2.2 Installing the Dashboard
Do the following in the order listed:
2.2.1 Verifying Your Operations Center Server’s Default Accounts and Configuration Settings
Review the following topics for information about the connections and communications with the Operations Center server:
Confirming Default Server Accounts
By default, the Operations Center’s default admin account is used to maintain a persistent connection between the Dashboard and the Operations Center server. While this can be changed later, verify the following default accounts still exist on the Operations Center server before installing the Dashboard:
-
admin
-
guest
If either of these accounts no longer exists, they need to be re‑created. If re‑creating the admin account, be sure to give it manage, define, access, and view permissions for the Users branch of the element hierarchy. This enables the account to create, delete, and update user accounts. The account does not need to be a member of the admins group.
Continue with Verifying Configuration Settings.
Verifying Configuration Settings
Because the Dashboard must communicate with the Operations Center server, we recommend verifying Operations Center server configuration settings before you start to install. For more information about the Configuration Manager and communication ports, see the Operations Center 5.6 Server Configuration Guide.
The Operations Center server to which the Dashboard establishes a connection is considered the default Operations Center server and the Dashboard obtains all its Operations Center content from this server. However, the Dashboard does allow additional connections to other Operations Center servers so that users can view and use content from multiple servers while viewing Web pages in the Dashboard. For more information, see Section 3.8, Creating Operations Center Server Profiles.
To verify and update Operations Center Configuration Settings:
-
Open the Operations Center Configuration Manager.
-
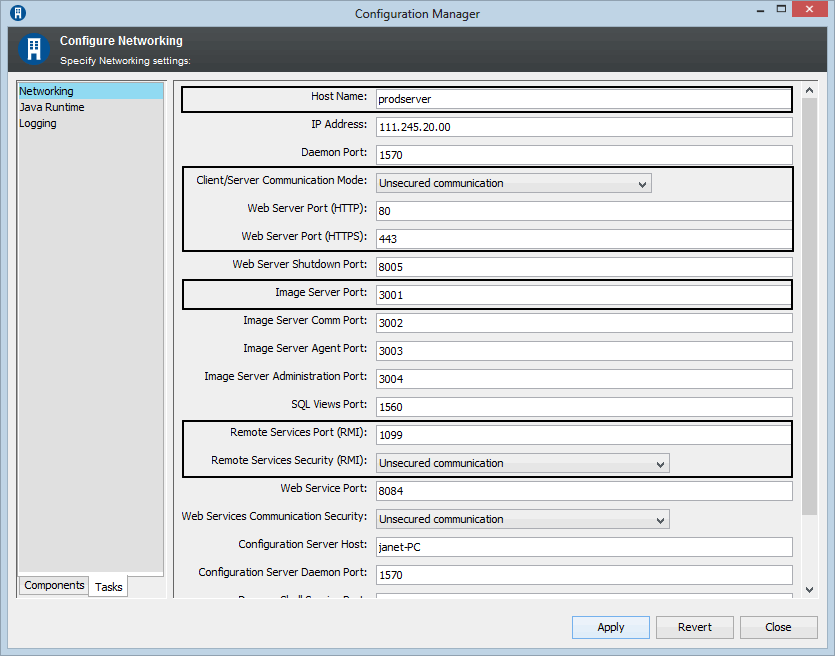
Switch to the Tasks tab (Networking section) to verify the following settings for the Operations Center server that are important for maintaining open communication between Operations Center and the Dashboard:
-
Host Name
-
Client/Server Communication Mode
-
Web Server Ports
-
Image Server Comm Port
-
Remote Services Port (RMI)
-
Dashboard Communications Security (for RMI communications security)
The Tasks tab on the Operations Center Configuration Manager allows you to view all Networking settings in a single list, as shown in the following illustration:
-
-
Because the RMI communications security can be set in Operations Center only, and is automatically detected by the Dashboard, do one of the following:
-
If Remote Services Security (RMI) is set to Secured communication using SSL, or Secured communication using SSL and Client Certificates, then:
-
Set Operations Center server’s RMI communications to secure.
-
Configure the Operations Center Web server for secure communications.
-
-
If Remote Services Security (RMI) is set to Unsecured communication, then:
-
Set Operations Center server’s RMI communications to unsecure.
-
Configure the Operations Center Web server for unsecure communications.
-
Use the Secured communication using SSL and Client Certificates option when running the Dashboard with a reverse-proxy scenario where the connecting client is always the Apache Web server. For more information about configuring the Dashboard with a reverse-proxy scenario or configuring Apache to deliver client certificates, contact Support as a Technical Information Document (TID) has been written on this subject.
For more information about securing communications between servers and setting up certificates, see
Communications Security
in Operations Center 5.6 Security Management Guide. -
-
(Unix Only) Configure the X11 Display Name for the display of images. Specify the display name where the server listens for connection with the virtual framebuffer.
For example, for a display name of 1 and screen name of 0, set to :1 or :1.0.
For more information, see Configuring Display for Images on UNIX in the Operations Center 5.6 Server Installation Guide.
-
Continue with Section 2.2.2, Installing the Dashboard.
2.2.2 Installing the Dashboard
Typically, the Dashboard is installed by using the Installation Wizard. It might also be installed using a console installation or an unattended (or silent) installation as detailed in Section B.0, Running a Console or Unattended Installation. For more information about any of these installation methods, see the Operations Center 5.6 Server Installation Guide.
To install the Dashboard:
-
(Recommended) Stop all programs before continuing especially those any programs that might interfere with the Operations Center installation.
-
If installing on Windows 2012 and using a DVD/CD, mounted ISO or mounted network install, do the following:
-
Locate the installation .exe file:
mount_location\Dashboard\Disk1\InstData\Windows\VM\install.exe -
Right-click the file and select Properties.
-
Open the Compatibility tab, mark the Run this program in compatibility mode for option and select Windows 7.
-
-
To obtain access to the installation files, do one of the following:
-
Insert the Operations Center Dashboard CD into the CD drive of the server where the software is to be installed.
-
Locate the Dashboard files that were downloaded on the server where the software is to be installed.
-
-
Do one of the following:
-
Windows: If the Installation Wizard does not launch automatically, run install.bat from a command prompt.
If User Access Control (UAC) is enabled, you must run the installation as the Administrator.
-
UNIX: Set the variable path to where the Java executable is, mount the CD, then run install.sh from the root.
-
-
On the License Agreement page, review the contents of the license agreement and select the I accept the terms of the License Agreement radio button if you agree with the terms.
-
On the Choose JVM page, do one of the following:
-
(Windows 32-bit) Select the Choose a Java VM already installed on this application radio button and select the desired Java VM from the list.
-
Select Search For Others to list additional installed VMs.
-
Select Choose Another to navigate to the location of the Java VM you want to use.
IMPORTANT:If installing on a Windows 32-bit platform, select a 32-bit JVM. If installing on a Windows 64-bit platform, select a 64-bit JVM. Dashboard cannot run if the wrong JVM is selected.
If installing on Solaris x64, be sure to modify the Apache Setclasspath.sh file to reference the Java path in your AMD64 installation in order for the Dashboard to start successfully. For example,
_RUNJAVA="/usr/jdk1.6.0_21/jre/bin/amd64/java"
-
-
On the Choose Install Folder page, click Next to accept the default installation directory. If necessary, click Choose to browse for a different location.
We recommend that you do not install the Dashboard in the same directory as the Operations Center server.
-
On the Dashboard Server Configuration page, do the following:
-
Specify the Dashboard communications mode by selecting one of the following Dashboard Communications Mode radio buttons:
-
http only to only use unsecure communications.
-
https only to only use secure communications.
-
both to allow both unsecure and secure communications.
-
-
Specify the http port the Dashboard is to use for http communications in the Dashboard Web Server Port (HTTP) field.
-
Specify the http port the Dashboard is to use for https communications in the Dashboard Web Server Port (HTTPS) field.
-
Click Next.
-
Specify the communications mode that the Dashboard uses to communicate with the Operations Center server by selecting one of the following Operations Center Communications Mode radio buttons:
-
http to use unsecure communication with Operations Center.
-
https to use secure communications with Operations Center.
-
-
Specify the host name of the Operations Center server in the NOC Host Name field.
-
Specify the port for web communications of the Operations Center server in the NOC Web Port field.
-
Click Next.
-
Select the Run Configuration Manager after install option to launch the Configuration Manager during installation.
-
Select whether the Dashboard Service will run under the local system account or a Windows user account. If you select User Account, also provide the account credentials.
-
-
On the Pre‑Installation Summary page, review the installation details and click Install.
-
While the Dashboard installs, note the following that occurs:
-
The status display updates as the Dashboard installs.
-
The Configuration Manager launches to configure settings for the installation if selected in Step 8.i.
Details on these settings are documented in Section 2.2.5, Configuring the Dashboard, Operations Center Server, and the Image Server.
-
-
When the install is complete, continue with Section 2.2.3, Configuring the Dashboard Database.
2.2.3 Configuring the Dashboard Database
While the Dashboard installs by default with an embedded Hypersonic SQL database, the Dashboard must be configured to use an Oracle or SQL Server database.
The following instructions provide instructions for configuring the Dashboard database:
Configuring Windows Servers for Database Single Sign On (SSO)
The Dashboard can be configured to use Server Domain Authentication for single sign on with Microsoft SQL databases. Windows servers require additional configuration for SSO functionality.
To configure Windows servers for Single Sign On with Dashboard MSSQL databases:
-
Stop the Dashboard.
-
Copy one of the following files into the directory containing the java.exe used by the Dashboard server:
-
On a 32-bit JVM: OperationsCenter_Dashboard_install_path/mssql/win32/ntlmauth.dll
-
On a 64-bit JVM: OperationsCenter_Dashboard_install_path/mssql/win64/ntlmauth.dll
-
-
Specify the domain, username and password when configuring the Dashboard portal-ext.custom.properties file.
For information on configuring the Dashboard database and properties file for SSO, continue to Configuring the Dashboard Database.
-
Restart the Dashboard.
Configuring the Dashboard Database
The following prepackaged JDBC drivers are installed with the Dashboard installation in the /OperationsCenter_Dashboard_install_path/server/lib/ext/ directory:
-
Oracle: ojdbc6.jar
-
SQL Server: jtds-1.2.5.jar
To configure the Dashboard to use an Oracle or SQL Server database:
-
If implementing with an Oracle database, see Configuring Oracle in the Operations Center 5.6 Server Configuration Guide for database configuration requirements.
-
Do one of the following to create the schema for the new database:
-
Oracle: Use the Oracle SQL*Plus Client to run the following scripts against your Oracle database.
/OperationsCenter_Dashboard_install_path/data/scripts/create-oracle.sql/OperationsCenter_Dashboard_install_path/data/scripts/init-oracle.sqlNote that the schema creation script contains some PL/SQL code which other jdbc based clients cannot execute.
-
SQL Server: Run the following scripts against your SQL Server database.
/OperationsCenter_Dashboard_install_path/data/scripts/create-sql-server.sql/OperationsCenter_Dashboard_install_path/data/scripts/init-sql-server.sql
-
-
Open the /OperationsCenter_Dashboard_install_path/server/webapps/ROOT/WEB-INF/classes/portal-ext.properties file, and locate and copy the properties for your database type in the Database Support section.
-
Paste these database properties into the /OperationsCenter_Dashboard_install_path/server/webapps/ROOT/WEB-INF/classes/portal-ext.custom.properties file, then uncomment the lines.
For example,
jdbc.default.driverClassName=net.sourceforge.jtds.jdbc.Driver
jdbc.default.url=jdbc:jtds:sqlserver://localhost:1433/myDB;instance=inst
jdbc.default.username=sa
jdbc.default.password=abc.123
Where,
Where, localhost is IP address or server name of SQL server, 1433 is the port that SQL database uses, myDB is the database name, and inst is the name of the instance of SQL.
Optionally, you can encrypt the password. For more information about encrypting the database password, see Section 12.1, Encrypting the Dashboard Database Password.
For more information about the portal-ext.properties and portal-ext.custom.properties files, refer to Section 3.9, Understanding Portal Properties Files.
-
(Optional) Specify the following if configuring the domain authentication with Microsoft SQL databases:
-
Append the database URL property with ;domain=domain_value
-
On Windows servers, leave the username and password properties blank to attempt to connect using the current Windows user account.
-
If running Operations Center Dashboard as a Windows service, the service must use the same domain user account as the database.
-
On Linux/UNIX servers, define the jdbc.default.username and jdbc.default.password properties with the username and password of the desired Windows account.
-
-
If the database installs without any errors, continue to Section 2.2.4, Verifying the Dashboard Default Time Zone for User Accounts and Section 2.2.5, Configuring the Dashboard, Operations Center Server, and the Image Server.
2.2.4 Verifying the Dashboard Default Time Zone for User Accounts
The default time zone for the portal is set to UTC for Dashboard users. It is important that its value be updated to an appropriate time zone if this is not the correct time zone for your users prior to the initial automatic synchronization with the Operations Center server.
Note that data in the Layout portlet and the Layout tab in the Information portlet displays based on the time zone of the Operations Center server, and not the time zone configured for the Dashboard.
To change the default time zone:
-
Open the /OperationsCenter_Dashboard_install_path/server/webapps/ROOT/WEB-INF/classes/portal-ext.properties file, and locate the list of time zones.
-
Open the /OperationsCenter_Dashboard_install_path/server/webapps/ROOT/WEB-INF/classes/portal-ext.custom.properties file. Add the user.timezone property, and define it using a time zone from the list in Step 1.
For more information about the portal-ext.properties and portal-ext.custom.properties files, refer to Section 3.9, Understanding Portal Properties Files
WARNING:When Dashboard users are created via the automatic synchronization with Operations Center server, their time zone is assigned based on the user.timezone property in the system-ext.properties file. If this property isn’t updated for the desired default time zone in the system-ext.custom.properties file prior to synchronization, each user must update their time zone individually via their Dashboard control panel. For more information about user synchronization, see Section 4.1, Operations Center and Dashboard Interaction.
2.2.5 Configuring the Dashboard, Operations Center Server, and the Image Server
The Operations Center Dashboard’s Configuration Manager and the Operations Center’s Configuration Manager are two different configuration managers. You need to use both managers to configure the Dashboard.
Configurations must be made for general Dashboard operation and communications with the Operations Center server. In order for the Dashboard to communicate with the Operations Center server, some configuration settings must match the settings of the Operations Center server’s configuration. These settings are found in the Operations Center Dashboard Configuration Manager and must match the same settings in the Operations Center Configuration Manager.
WARNING:Changing the settings in either Configuration Manager replaces existing configuration files and any manual changes are lost.
To configure the Dashboard:
-
To access the Operations Center Dashboard Configuration Manager, do one of the following:
-
Windows: You have two options:
-
Click Start > All Programs > NetIQ Operations Center > NetIQ Operations Center Dashboard > Configure NetIQ Operations Center Dashboard.
-
At the DOS prompt, run customizer from the \OperationsCenter_Dashboard_install_path\bin directory.
-
-
UNIX: At a command prompt, run Customizer from the /OperationsCenter_Dashboard_install_path/bin directory.
-
-
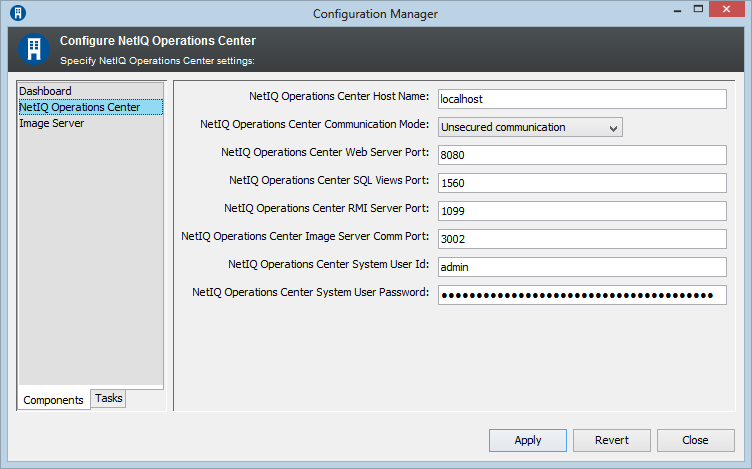
Click NetIQ Operations Server in the Component-s tab.
-
Configure the following settings:
NetIQ Operations Center Server Host Name: The host name for the Operations Center server.
NetIQ Operations Center Server Communication Mode: The method of communication for the Operations Center server. Select between Unsecured communication or Secured communication using SSL.
NetIQ Operations Center Server Web Server Port: The Web server port for the Operations Center server. If using unsecured communication, specify the Web Server Port number for HTTP from the Operations Center server. Or, if using Secured communication using SSL, specify the Web Server Port number for HTTPS from the Operations Center server.
NetIQ Operations Center Server SQL Views port: The port used by SQL Views for access to the Operations Center server. For more information, see the Operations Center 5.6 SQL Views Guide.
NetIQ Operations Center Server RMI Server Port: The RMI server port for the Operations Center server. The default RMI port is 1099. Value must match the RMI server port specified in the Operations Center configuration manager. If the port is changed in the Dashboard Configuration Manager, then the port value must be updated in the Operations Center Configuration Manager, and vice versa.
NetIQ Operations Center Server Image Server Comm Port: The Image Server’s Communication Port for the Operations Center server. If using a portlet that accesses the Operations Center server’s Image server, value must match the Image server communications port that is specified in the Operations Center configuration manager. The Operations Center server’s Image server can be accessed from the Dashboard IP Address. For more information on this, see the Operations Center 5.6 Server Configuration Guide.
NetIQ Operations Center Server System User Id: The user name of the Operations Center admin account that is used for handling the persistent connection for user synchronization between the Dashboard and Operations Center.
For more information about user and group synchronization and the default admin account, see Section 4.1, Operations Center and Dashboard Interaction.
For more information about changing the default admin account, see Section 3.5, Changing the Dashboard Account for Persistent Connection
NetIQ Operations Center Server System User Password: The corresponding password of the Operations Center admin account specified in the Operations Center server’s System User Id field.
-
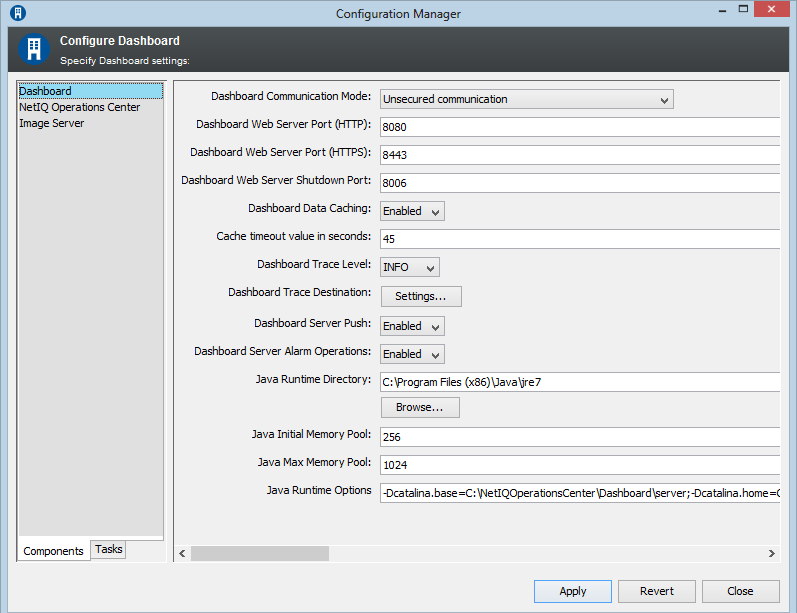
To access the Dashboard configuration options, click Dashboard in the Components tab.
-
Configure the following Dashboard settings:-
Dashboard Communication Mode: The method of communication for the Dashboard. Select Unsecured communication, Secured communication using SSL, or Support both unsecured and secured communication.
Dashboard Web Server Port (HTTP): The port to access the Dashboard if using an unsecured communication protocol.
IMPORTANT:For all ports, verify that the port does not conflict with a port already in use.
Dashboard Web Server Port (HTTPS): The port to access the Dashboard if using a secure communication protocol.
Dashboard Web Server Shutdown Port: The TCP/IP port number to which the Dashboard listens for a shutdown command.
Dashboard Data Caching: The RMI connection between the Dashboard and Operations Center uses a memory sensitive cache to retain data for a predetermined amount of time. This cache resides on the Dashboard application and reduces the amount of calls to the Operations Center server. By default, the caching mechanism is enabled. Note that because this is a memory sensitive cache, it is purged if memory demands are exceeded by the Dashboard application.
Cache timeout value in seconds: The amount of time the data caching mechanism holds onto data. Defaults to 45 seconds.
Dashboard Trace Level: Controls how much information is passed to the server trace logs. Defaults to INFO, which is recommended. The trace levels are:
-
ERROR: Logs error messages only.
-
WARN: Logs error and warning messages.
-
INFO: Logs informational, error, and warning messages.
-
DEBUG: Logs all information and as the most detailed setting should be used only to track down problems.
Dashboard Trace Destination: Specifies the location of trace log output file. By default, all logging is saved to /OperationsCenter_Dashboard_install_path/server/logs/dashboard.trc.
On application startup, the current version of the Dashboard and a listing of all environment variables are written to the trace file. For more information, see Section D.0, Troubleshooting Trace Logs.
Dashboard Server Push: Push technology allows data from the Operations Center server to be received as new data appears. If disabled, data is only sent when the user refreshes or loads a page. By default, this option is enabled and applies to all Operations Center portlets that support push technology. However, push settings can be overridden for each individual portlet taking precedence over this setting in the Operations Center Dashboard Configuration Manager. For more information, see Section 7.8.6, Automatic Data Updates with Push Technology.
Dashboard Server Alarm Options: Enables alarm operations similar to those on the Operations Center console. By default, this option is enabled and applies to alarms components for all Operations Center portlets. However, alarm options can also be overridden for each individual portlet taking precedence over this setting in the Operations Center Dashboard Configuration Manager. For more information, see Section 8.1.3, Applying and Creating Alarm Filters.
-
-
Specify Java configuration options:
Java Development Kit Directory: The location of the JDK used by the Dashboard. Click Browse to select a new location.
Java Initial Memory Pool: (Windows Only) Initial and minimum Java heap size in megabytes.
Java Max Memory Pool: (Windows Only) Maximum Java heap size in megabytes.
Java Runtime Options: List of command line options in the form of -D or -X that are passed to the JDK. For Windows, separate entries with a semicolon. For UNIX, separate entries with a space.
For more information about JRE requirements, see
Requirements for the Dashboard and CMS
in the Operations Center 5.6 Getting Started Guide. -
To access the Image Server configuration options, click Image Server in the Components tab.
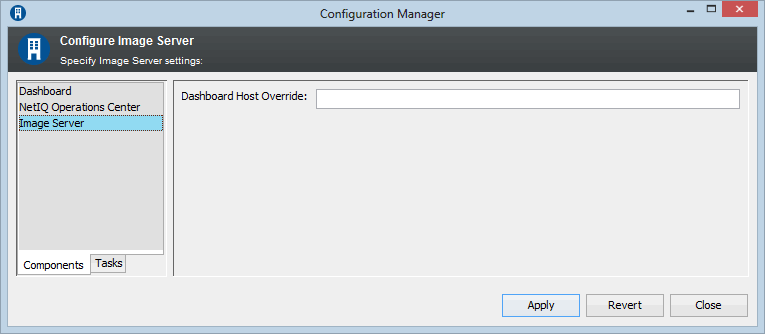
Dashboard Host Override: If running in SSL mode, specify a host name for the image server to call back to the dashboard. Set the host name to the same host name as used in the cacerts trust store for the Operations Center server. The Chart Builder functionality relies on the Image server for delivery of charts.
-
To restart the Dashboard, continue with Section 2.2.6, Starting the Dashboard for the First Time and Verifying the Installation.
After making changes in the Configuration Manager, it is necessary to restart the Dashboard for any changes to take affect.
2.2.6 Starting the Dashboard for the First Time and Verifying the Installation
The last step to installing the Dashboard is to start the Dashboard and log in to verify a successful connection.
IMPORTANT:At the initial start up of the Dashboard server, a user synchronization process imports all users and groups from the Operations Center server into the Dashboard. For more information about the user synchronization process, see Section 4.1, Operations Center and Dashboard Interaction.
When user accounts are created, a default time zone is assigned based on a property setting in the portal-ext.properties file. Be sure to validate, and override this setting if necessary in the portal-ext.custom.properties file, before starting the Dashboard server for the first time. For more information about time zone settings, see Section 2.2.4, Verifying the Dashboard Default Time Zone for User Accounts.
For more information about the portal-ext.properties and portal-ext.custom.properties files, refer to Section 3.9, Understanding Portal Properties Files
For more information on starting the Dashboard, see Section 2.3.1, Starting the Dashboard.
To log in to the Dashboard:
-
From your Web browser, access the URL of the Dashboard server:
http://server:dashboard_port
For example, the Dashboard is installed on your current machine and the HTTP port (Operations Center Dashboard Configuration Manager) set to 8080, then point your browser to:
http://localhost:8080
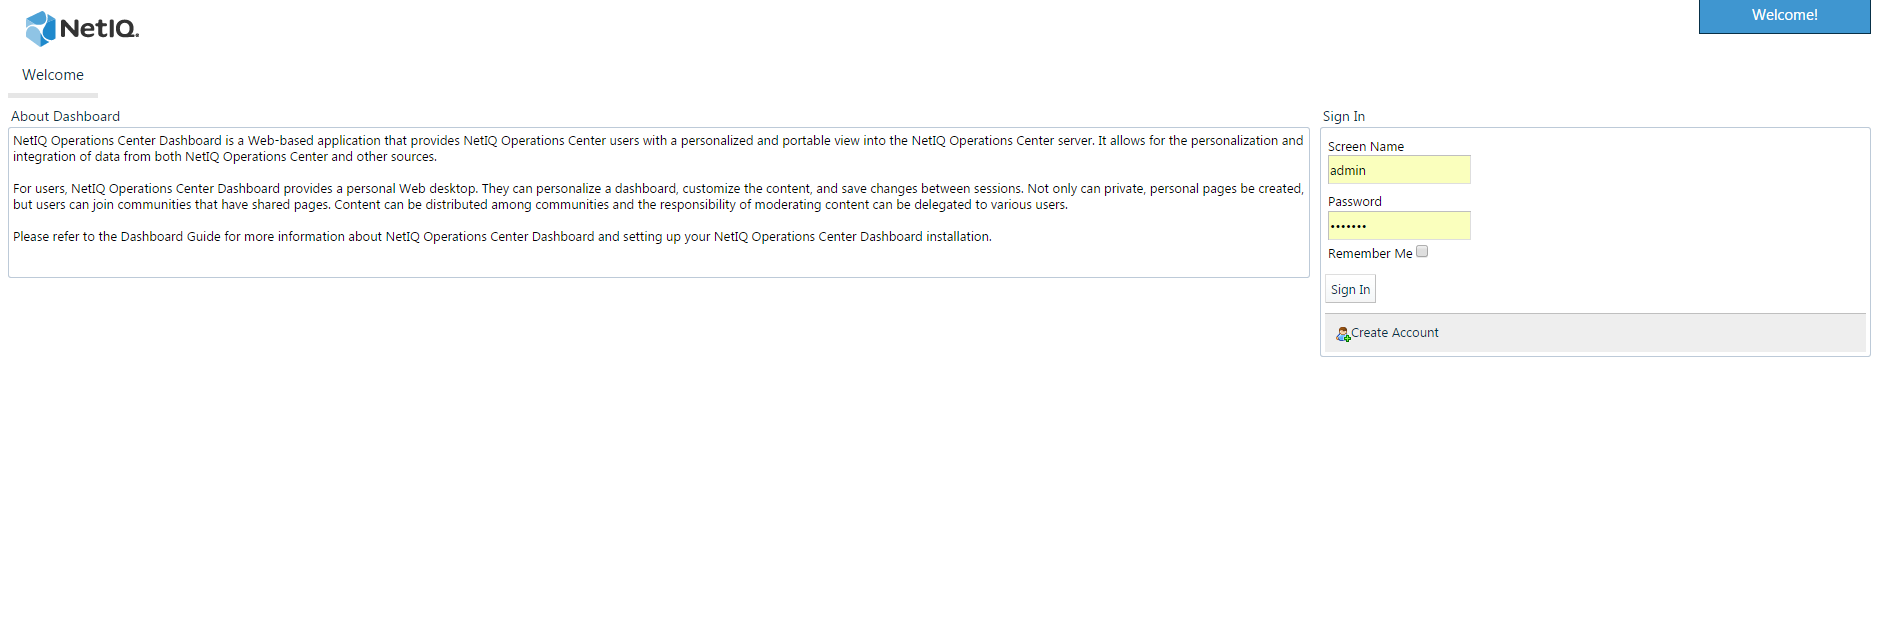
When successful, the guest home page for the Dashboard displays:
-
To verify RMI communication settings between the Dashboard and the Operations Center server, log in to the Dashboard.
Use the Operations Center default admin account credentials.
If successful, the Dashboard establishes a persistent administration connection to the Operations Center server. This connection is then used to verify the credentials provided by users in the login portlet. If the credentials are correct, the Access Control Synchronizer starts and users from Operations Center are imported.
After logged into the Dashboard, you can add and update content from your personal home page.
Next, configure the URL settings. For more information, see Section 3.2, Updating Dashboard Administrative Configurations.
-
If the connection or authentication fails, do the following as necessary:
-
Confirm your administrator default account credentials.
-
Verify that you are using the correct HTTP or HTTPS port.
-
For all port configurations, verify that the port does not conflict with a port already in use.
-
Confirm that the RMI connections specified in the Operations Center Dashboard Configuration Manager and the Operations Center Configuration Manager match.
If settings are changed in the Configuration Manager, restart the associated server.
-
Review the dashboard.trc file for error messages.
-
Add the Dashboard server as a trusted site.
For IE 7+ in Windows Vista or Windows Server 2008 and running in Protected Mode, the Dashboard server must be added as a trusted site before the Dashboard can function normally.
To add the Dashboard to the list of trusted sites, click Tools and select Internet Options. Select the Security tab and click Trusted Sites. Click Sites and specify the Dashboard host as a trusted site.
-
2.2.7 Update Dashboard Configuration Settings
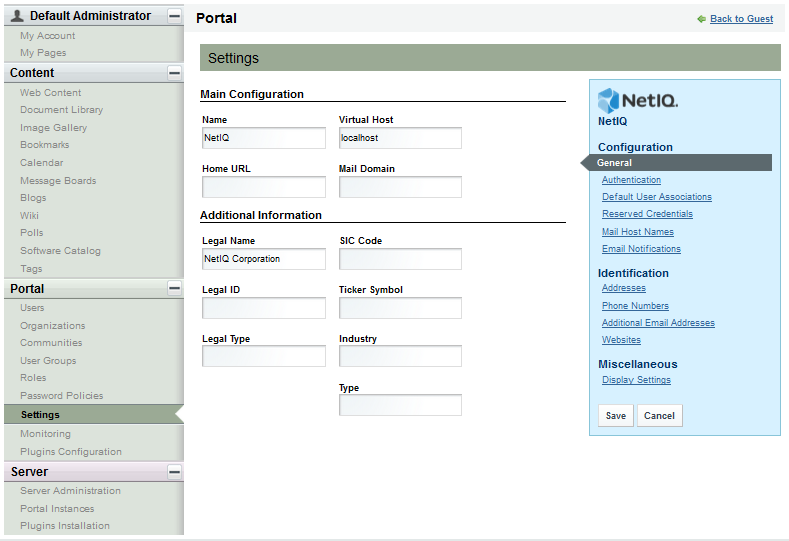
For the Dashboard to function properly, the Virtual Host and Mail Domain settings need to be updated. Else, the Dashboard users might encounter redirect issues when navigating to the Dashboard or when the Dashboard is unable to send e-mail notifications.
For more information about other the Dashboard portal configuration settings, see Section 3.2, Updating Dashboard Administrative Configurations.
To update the Virtual Host and Mail Domain for the Dashboard:
-
Click Welcome and select Control Panel.
-
Under Portal, select Settings.
-
Specify the fully qualified host name for the server where the Dashboard is running in the Virtual Host field.
-
Specify the domain name for the mail host for this instance in the Mail Domain field.
-
Click Save to save all updated settings.
-
Click Back to exit the Control Panel.