6.1 Testing the Rapid Deployment Installation
The following procedure describes the steps to test the Sentinel Rapid Deployment system and the expected results. You might not see the same events, but your results should be similar to the results below.
At the basic level, these tests allow you to confirm the following:
-
Sentinel services are up and running.
-
Communication over the message bus is functional.
-
Internal audit events are being sent.
-
Events can be sent from a Collector Manager.
-
Events are inserted into the database and can be retrieved by using a report.
-
Incidents can be created and viewed.
-
Rules are evaluated and correlated events are triggered by the Correlation Engine.
-
The Sentinel Data Manager is connected to the database and can read the partition information.
If any of these tests fail, review the installation log and other log files, and contact Novell Technical Support, if necessary.
To test the installation:
-
Log in to a Sentinel Rapid Deployment Web interface.
For more information, see
Accessing the Novell Sentinel Web Interface
in the Sentinel Rapid Deployment User Guide. -
Select the Search page and search for any internal event. One or more events should be returned.
For example, to search for internal events within the severity range 3-5, select , then enter in the field.
For more information on Search, refer to
Running an Event Search
in the Sentinel Rapid Deployment User Guide.The Search feature is not enabled by default in SP2. However, if you want to enable this feature, refer to
Enabling the Search Option in Web User Interface
in the Sentinel Rapid Deployment User Guide. -
Select the Reports page, specify the parameters, then run a report.
For example, click the button next to Sentinel Core Event Configuration, specify the desired parameters, then click .
For more information, refer to
Running Reports
in the Sentinel Rapid Deployment User Guide. -
On the Applications page, click .
-
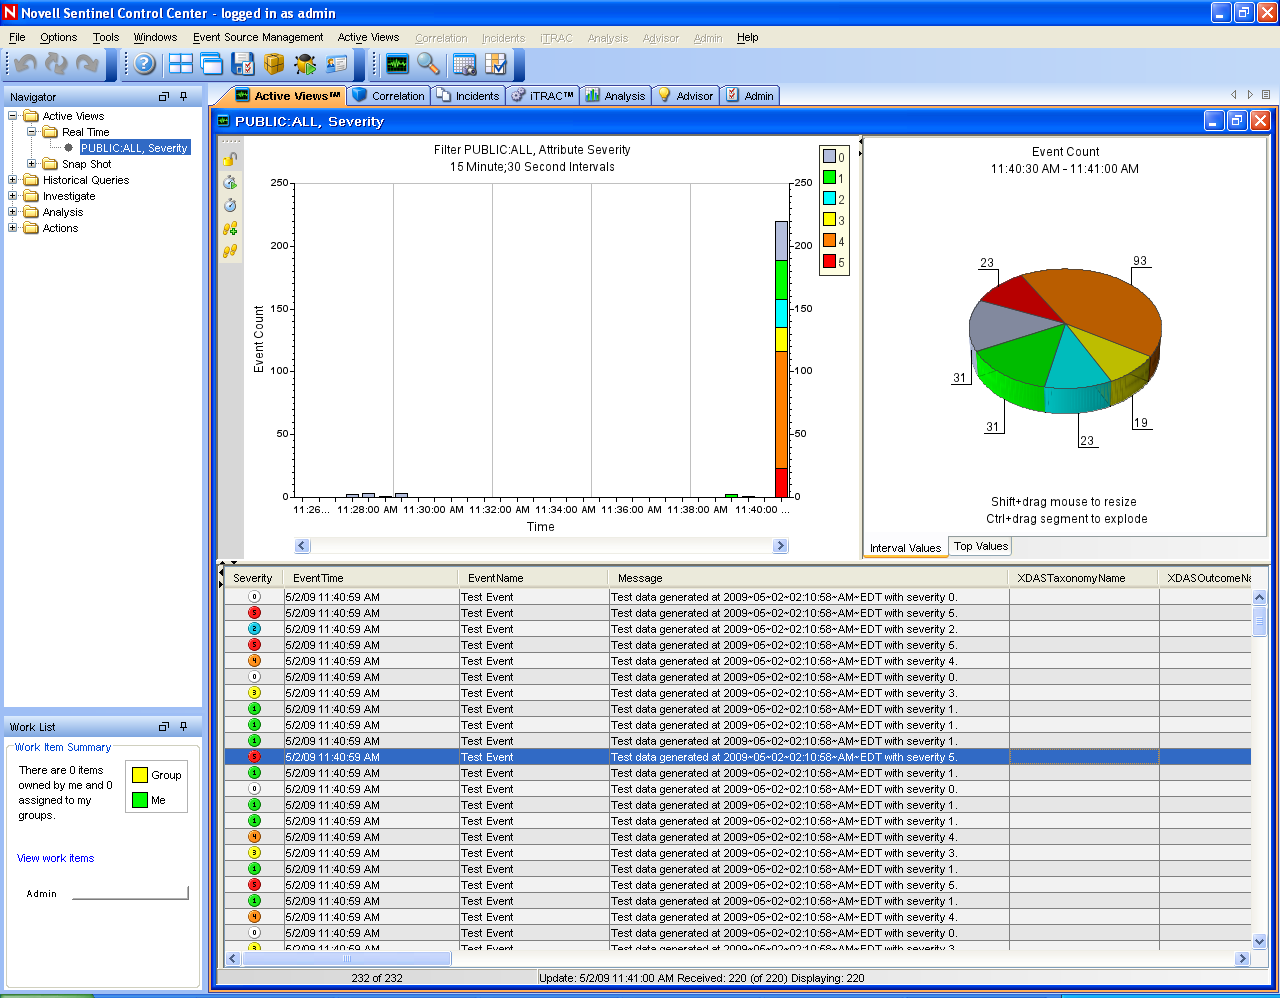
Log in to the system by using the Sentinel Administrative User specified during installation (admin by default).
The Sentinel Control Center opens, and you can see the tab with the events filtered by the and public filters.
-
Go to the menu, then select .
-
In the Graphical view, right-click , then select .
-
Close the Event Source Management Live View window.
-
Click the tab.
You can view the Active window titled PUBLIC: High_Severity, Severity. It might take some time for the Collector to start and the data to be displayed in this window.
-
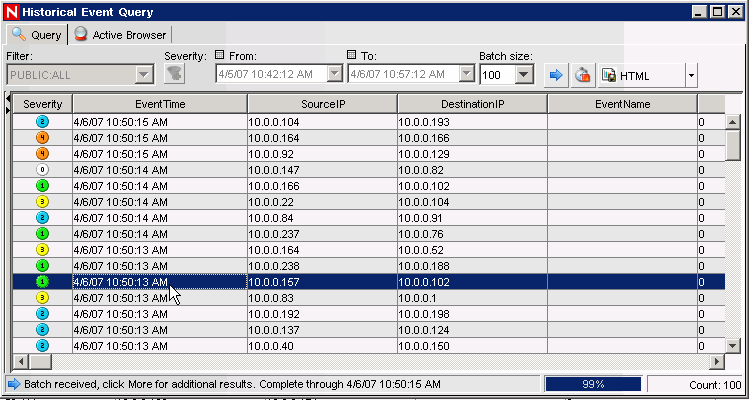
Click the button on the toolbar. The Historical Event Query window is displayed.
-
In the Historical Event Query window, click the down-arrow to select the filter. Select filter.
-
Select a time period that covers the time during which the Collector has been active. Use the and drop-down lists to select the date range.
-
Select the batch size.
-
Click the magnifying glass icon to run the query.
-
Hold down the Ctrl or Shift key, then select multiple events from the Historical Event Query window.
-
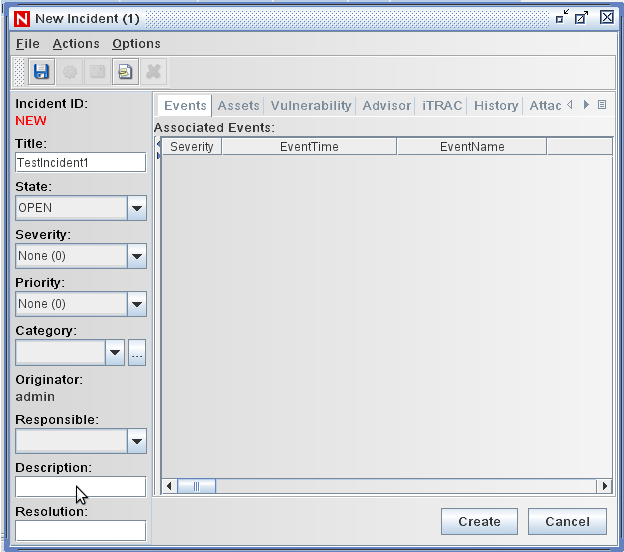
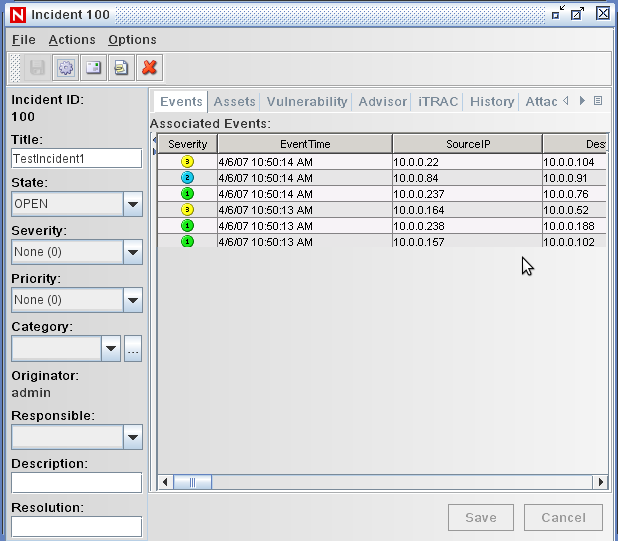
Right-click in the window, then select to display the New Incident window.
-
Name the incident TestIncident1, then click . When a success notification displays, click .
-
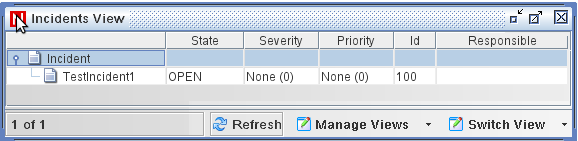
Click the tab to see the incident you just created in the Incident View Manager.
-
Double-click the incident to display the events.
-
Close the Incident window.
-
Click the tab.
-
Click from the menu or from the Navigator.
-
In the Offline Query window, click .
-
Specify a name, select a filter, select a time period, then click .
-
Click to view the list of events and associated details in the Active Browser window.
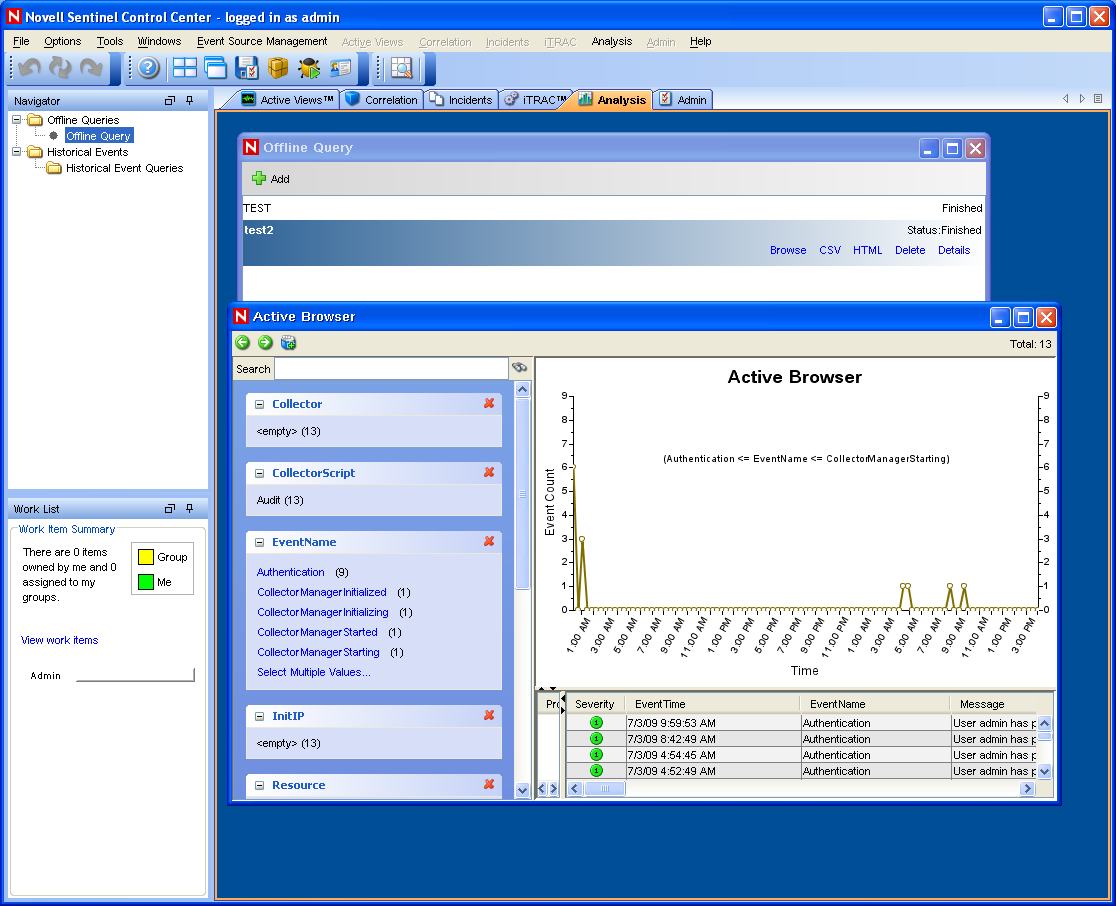
You can view the details such as Collector, Target IP, Severity, Target Service Port, and Resource.
-
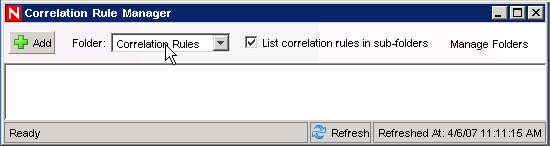
Select the tab. The Correlation Rule Manager is displayed.
-
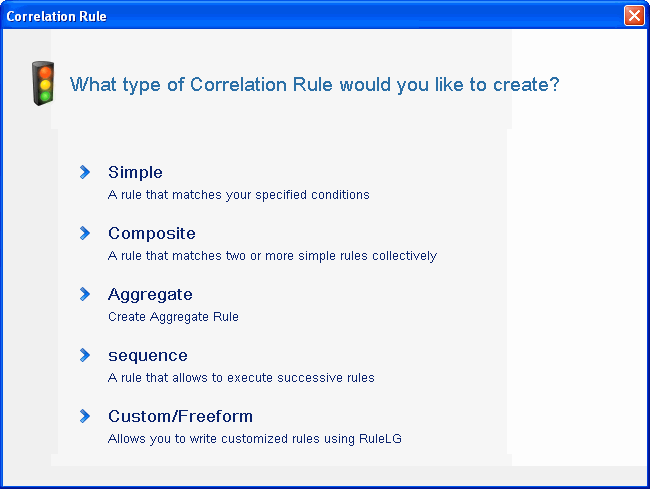
Click . The Correlation Rule Wizard is displayed.
-
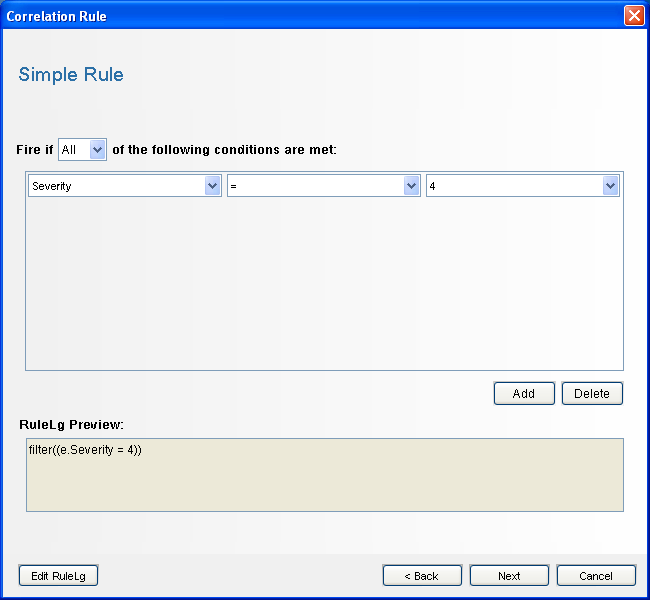
Click . The Simple Rule window is displayed.
-
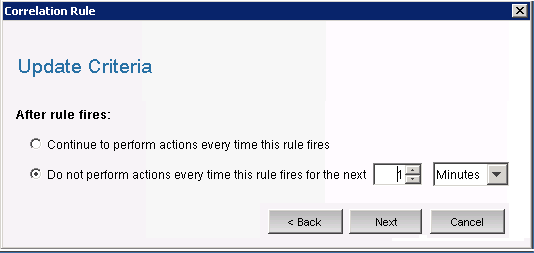
Use the drop-down menus to set the criteria to Severity=4, then click. The Update Criteria window is displayed.
-
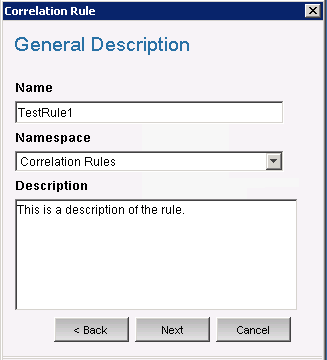
Select use the drop-down menu to set the time period to 1 minute, then click . The General Description window is displayed.
-
Name the rule as , provide a description, then click .
-
Select and click t.
-
Create an action to associate with the rule you have created:
-
Perform either of the following:
The Configure Action window is displayed.
-
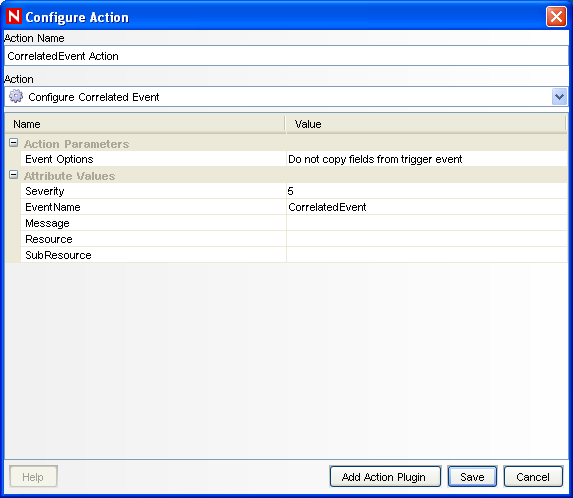
In the Configure Action window, specify the following:
-
Specify the action name, such as CorrelatedEvent Action.
-
Select from the drop-down list.
-
Set the .
-
Set the to 5.
-
Specify the , such as CorrelatedEvent.
-
Specify a message, if necessary.
For more information on creating an action, see
Creating Actions
in the Sentinel Rapid Deployment User Guide. -
-
Click .
-
-
Open the Correlation Rule Manager window.
-
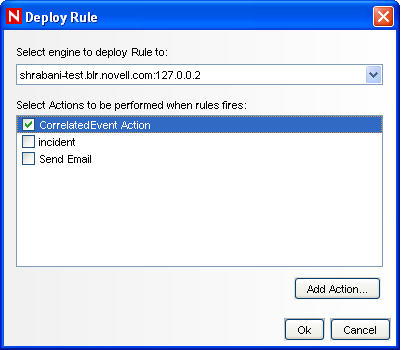
Select a rule, then click the link. The Deploy Rule window is displayed.
-
In the Deploy Rule window, select the Engine to deploy the rule.
-
Select the action you created in Step 33 to associate with the rule, then click .
-
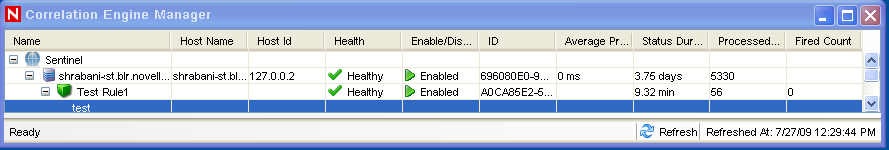
Select.
Under the Correlation Engine, you can see the rule is deployed and enabled.
-
Trigger an event of severity 4, such as failed authentication to fire the deployed correlation rule.
For example, open a Sentinel Control Center login window, then specify wrong user credentials to generate such an event.
-
Click the tab, then verify if the Correlated Event is generated.

-
Close the Sentinel Control Center.
-
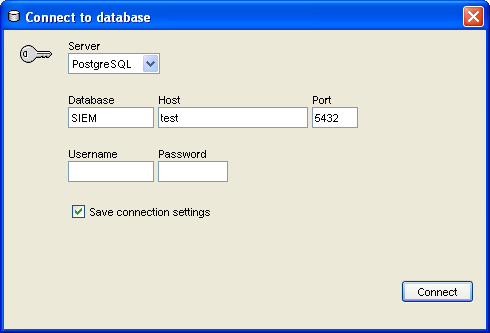
On the Applications page, click .
-
Log in to Sentinel Data Manager by using the Database Administrative User specified during installation (dbauser by default).
-
Click each tab to verify that you can access it.
-
Close Sentinel Data Manager.
If you proceeded through all of these steps without errors, you have completed the basic verification of the Sentinel system installation.