3.2 Dashboard Overview
The Dashboard page of the PlateSpin Protect Web Interface contains elements for navigating to different functional areas of the interface and carrying out workload protection and recovery operations.
Figure 3-1 The Default Dashboard Page of the PlateSpin Protect Web Interface
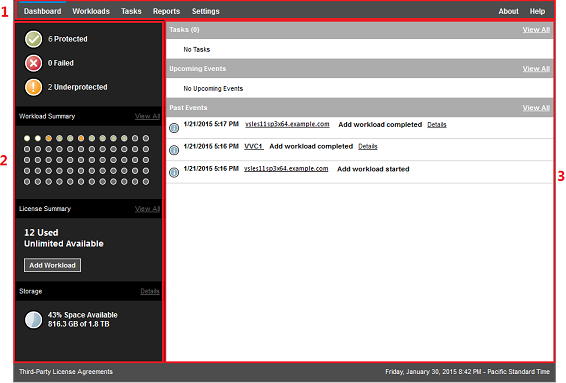
The Dashboard page consists of the following elements:
-
Navigation bar: Found on most pages of the PlateSpin Protect Web Interface.
-
Visual Summary panel: Provides a high-level view of the overall state of the PlateSpin Protect workload inventory,
-
Tasks and Events panel: Provides information about events and tasks requiring user attention.
The following topics provide more details:
NOTE:You can alter certain elements of the Web Interface to match your organization branding. For more information, see Rebranding the PlateSpin Protect Web Interface.
3.2.2 Visual Summary Panel
The Visual Summary panel provides a the high-level protection status of inventoried workloads, the status of each licensed workloads, a license usage summary, and the amount of available storage.
Protection Status
The overall protection status of inventoried workloads are represented by three categories:
-
Protected: Indicates the number of workloads under active protection.
-
Failed: Indicates the number of protected workloads that the system has rendered as failed according to that workload’s Protection Tier.
-
Underprotected: Indicates the number of protected workloads that require user attention.
Workload Summary
The Workload Summary presents the health status of each licensed workload listed on the Workloads page. The maximum number of workload status dot icons matches the number of installed workload licenses on the PlateSpin Server. For an unlimited license, the summary displays 96 dot icons. Table 3-1 describes the different workload states represented by the dot icons.
The icons represent workloads in alphabetical order, according to the workload name. Mouse over a dot icon to display the workload name, or click the icon to display the corresponding Workload Details page.
Table 3-1 Dot Icon Workload Representation
|
|
|
|
|
|
|
|
|
|
|


License Summary
The License Summary displays the number installed licenses, and the number of licenses currently used by the workloads.
Storage
provides information about the total amount of container storage space available to PlateSpin Protect, and the amount of space that is currently in use.