6.1 Service Monitoring
Assume that you have a service that is dependent on different aspects of your infrastructure, including data from asset management, change management, and incident management. There are certain critical properties of each of these aspects that a senior manager wants to monitor. You can use version history to do this.
-
Set up service configuration for an element and its children so that the elements have properties that match the aspects of the infrastructure to be monitored.
The property page has the following fields:
-
Asset tag # from asset management
-
Active change requests from change management
-
Active incidents from incident management
-
-
Create a new element called Critical Service, and apply the property sheet with these properties to it, so the properties are changed.
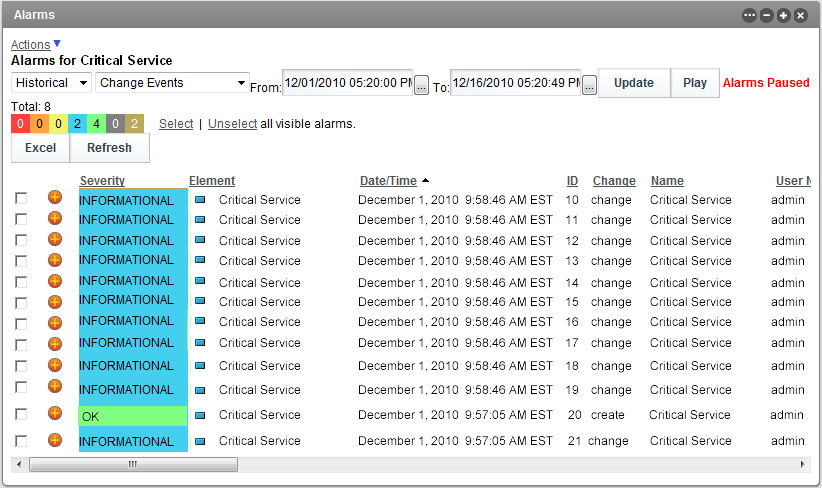
The Alarm view in the Operations Center console displays these change events. For information on how to view change events in the Alarms view, see Section 3.2, Alarms View.

These change events are also displayed in an Alarms portlet in the dashboard. For more information on how to configure the dashboard portlet for change events, see Section 3.3, Alarms Portlet in the Dashboard.
Figure 6-1 Change Events in the Alarms Portlet
-
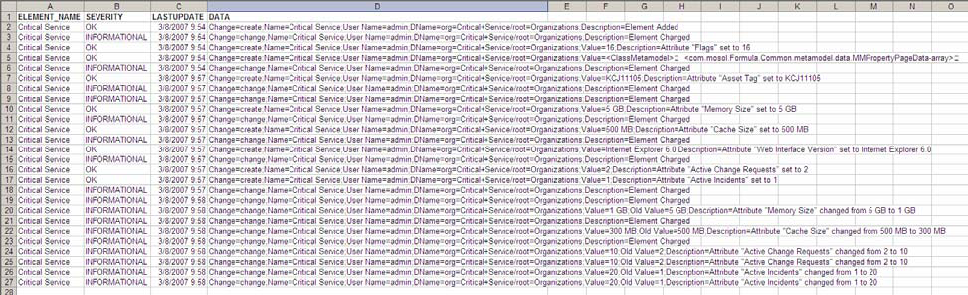
In addition to monitoring these events, report on them:
Figure 6-2 Excel Report Created Using SQL Views
-
For this, you can use SQL Views by setting the SYSTEM_ELEMENTS_ALARMS view to capture alarms of the type Change Events.
-
Then use this view to create a report in your reporting tool (such as Microsoft Excel or Business Objects Crystal Reports).
For more information on version history and SQL Views, see Section 3.4, SQL Views.
For more information about SQL Views, see the Operations Center 5.6 SQL Views Guide.
-