The status of elements and SLAs can be monitored in both the Operations Center console and dashboard:
The Operations Center console provides two options for monitoring the status of SLAs:
Service Level Agreement property page
Network view
The property pages for an element include a Service Level Agreement page. The Status tab of the Service Level Agreement property page displays a status summary for the SLA status, as well as its objectives:
Figure 6-2 Status on the Service Level Agreements Property Page
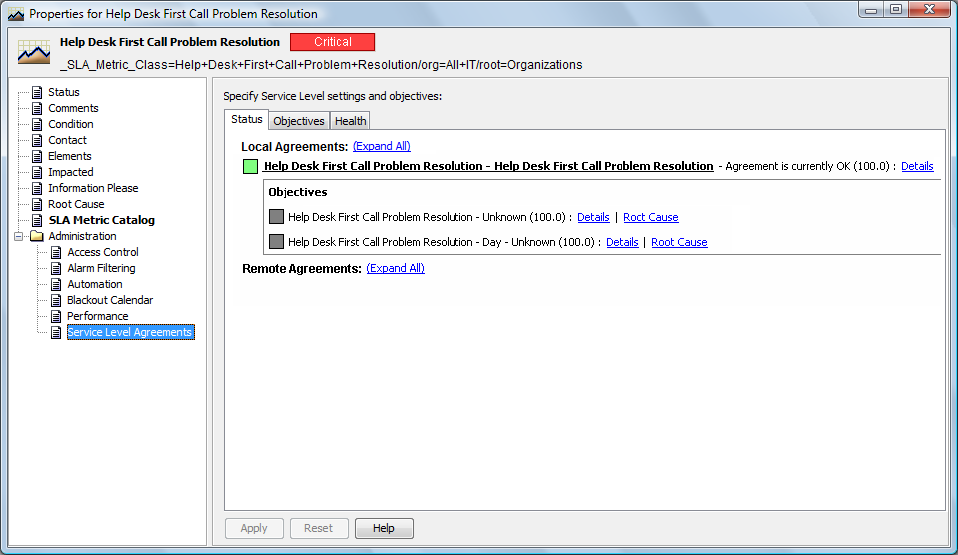
Obtain additional details for each and view the details for the root cause of any warnings or violations.
The Network view is available for any element in the Operations Center hierarchy. View the relationships for an element or a Service Level Agreement. Service Level Agreement and objectives are located in the hierarchy under Enterprise.
The Operations Center dashboard has portlets that display basic data about elements, such as status, root cause of the current condition, and other elements impacted by the element, as well as SLA reporting portlets:
SLA Compliance Portlet: View health, downtime, availability, outages, and breaches related to SLAs for specified elements over a specified interval of time.
For more information about SLA compliance reporting, see Section 7.0, SLA Reporting, or SLA Reporting Portlets
in the Operations Center 5.6 Dashboard Guide.
SLA Status Portlet: View compliance/availability from a status or summary perspective with links to SLA Compliance reports.
For more information about SLA reporting, see Section 7.0, SLA Reporting, or SLA Reporting Portlets
in the Operations Center 5.6 Dashboard Guide.
Alarms Portlet: View Service Level breaches or Service Level metrics depending on portlet configuration.
For more information about the Alarms portlet, see Configuring the Alarms Portlet
in the Operations Center 5.6 Dashboard Guide.
Status Portlet: Shows a list of elements with the current status and can show additional information such as the date and time that the element was last updated, notes for the element, and links to other components..
For more information about the Alarms portlet, see Configuring the Status Portlet
in the Operations Center 5.6 Dashboard Guide.
Root Cause Portlet: Provides information about why the element is at its current condition. When reporting on the compliance and health of an objective or SLA with an SLA Compliance Report, also obtain information on root cause. The root cause information can include such information as the current availability compared to what it should be, the dates and times of all violations, and the number of relevant outages.
For more information about the Alarms portlet, see Configuring the Root Cause Portlet
in the Operations Center 5.6 Dashboard Guide.
Show Impacted Portlet: Provides information about how the element is affecting other elements.
For more information about the Alarms portlet, see Configuring the Show Impacted Portlet
in the Operations Center 5.6 Dashboard Guide.