4.7 SS_CallQuality
Use this Knowledge Script to monitor call quality statistics on the Avaya Signaling Server: audio setups, voice time, average and maximum jitter, latency, lost packets, listening R-factor, and Mean Opinion Score (MOS). This script raises an event if a statistic exceeds the threshold you set. In addition, this script generates the following data streams:
-
Total number of audio setups, which is the number of call legs established in a call. A simple call may have only one audio setup, but a conference call or a call on hold can have multiple audio setups.
-
Average and maximum percentage of lost data packets, calculated based on the number of expected packets and the number of packets actually received. The number of packets received includes those that were late or duplicates. Packets that arrive late are not counted as lost. The presence of duplicate packets can result in a negative value for lost data.
-
Average and minimum listening MOS on the phones (CS1000 versions 4.0 and later only). The Listening MOS value represents the overall quality of a call from the listener’s perspective. The MOS is a number between 1 and 5. A MOS of 5 is excellent. A MOS of 1 is unacceptably bad. The MOS calculation considers measured items plus jitter buffer size. AppManager uses a modified version of the ITU (International Telecommunications Union) G.107 standard E-model equation to calculate the MOS. This algorithm is used to evaluate the quality of a transmission by factoring in the “mouth to ear” characteristics of a speech path.
-
Average and minimum listening R-factor on the phones (CS1000 versions 4.0 and later only). The E-model equation that calculates MOS also calculates R-factor. R-factors range from 100 (excellent) to 0 (poor), and are a direct measure of call quality or transmission quality with respect to codec type and quality factors such as packet loss and delay. A Listening R-factor score represents call or transmission quality from a listener’s perspective.
-
Total voice time, in seconds, for all calls of a particular set type during the reporting period.
-
Average and maximum jitter for each selected phone model. Jitter is the mean deviation of the difference in RTP data packet spacing at the receiver compared to the sender for a pair of packets.
-
Average and maximum latency for each selected phone model. Latency is the average value of the difference between the time stamp indicated by the senders of messages and the timestamp of the receivers, measured when the messages are received. The average is obtained by adding all of the estimates, then dividing by the number of received messages.
For more information, see Section 4.7.6, Understanding How Data Streams are Calculated.
4.7.6 Understanding How Data Streams are Calculated
This topic applies to call metrics monitored by the following Knowledge Scripts:
AppManager retrieves CS1000 call metrics (audio setups, voice time, jitter, latency, R-factor, MOS, registration, and lost packets) from the Operational Measurement (OM) Reports created each hour on the Signaling Server, VGMC, MC32S, and MGC.
OM Reports provide call data per phone model, not per phone. For example, the OM Report identifies the average jitter for all of the i2004 model phones, but does not identify the jitter value for each phone of that model. In addition, the OM Report collects average and maximum values for jitter and latency, but only a single value for R-factor, voice time, registration, and audio setups.
Therefore, when you run a data collection script, it is important to understand that the resulting data streams are based on groups of phone types and are limited by the type of raw data available in the OM Report. The following table illustrates how each data stream is calculated:
|
Data Stream |
What the OM Report Provides |
How Data Stream is Calculated |
|---|---|---|
|
Total number of audio setups |
Total number of audio setups for each phone model |
AppManager finds the total number of audio setups from all of the phone models you choose to monitor. For example, you choose to monitor three phone types. The total number of audio setups for type A is 3, for type B is 6, and for type C is 9. The total of these three values is 18, which is the value represented by the data stream. |
|
Average jitter |
Average amount of jitter for each phone model |
AppManager computes a weighted average of all the phone models you choose to monitor, based on the OM Report values for total voice time and average jitter. For example, you choose to monitor three phone types. The average amount of jitter for type A is 1 ms, for type B is 2 ms, and for type C is 3 ms. The amount of voice time for the three phone types is 2, 3, and 4 seconds, respectively. AppManager computes the weighted average using the following formula, in which AJ = average jitter and VT = voice time: 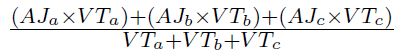
In the formula, the products of average jitter and voice time for each phone type are added together and then divided by the sum of the voice time values. In this example, the computed weighted average jitter is 2.222. |
|
Maximum jitter |
Maximum amount of jitter for each phone model |
AppManager finds the highest amount of maximum jitter from all of the phone models you choose to monitor. For example, you choose to monitor three phone types. The maximum amount of jitter for type A is 1 ms, for type B is 2 ms, and for type C is 3 ms. The maximum of these three values is 3 ms, which is the value represented by the data stream. |
|
Average latency |
Average amount of latency for each phone model |
AppManager computes a weighted average of all the phone models you choose to monitor, based on the OM Report values for total voice time and average latency. For example, you choose to monitor three phone types. The average amount of latency for type A is 1 ms, for type B is 2 ms, and for type C is 3 ms. The amount of voice time for the three phone types is 2, 3, and 4 seconds, respectively. AppManager computes the weighted average using the following formula, in which AL = average latency and VT = voice time: 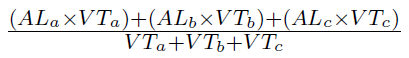
In the equation, the products of average latency and voice time for each phone type are added together and then divided by the sum of the voice time values. In this example, the computed weighted average latency is 2.222. |
|
Maximum latency |
Maximum amount of latency for each phone model |
AppManager finds the highest amount of maximum latency from all of the phone models you choose to monitor. For example, you choose to monitor three phone types. The maximum amount of latency for type A is 1 ms, for type B is 2 ms, and for type C is 3 ms. The maximum of these three values is 3 ms, which is the value represented by the data stream. |
|
Average percentage of lost packets |
Total percentage of lost packets for each phone model |
AppManager computes a weighted average of all the phone models you choose to monitor, based on the OM Report values for total voice time and lost packets. For example, you choose to monitor three phone types. The percentage of lost packets for type A is 1%, for type B is 2%, and for type C is 3%. The amount of voice time for the three phone types is 2, 3, and 4 seconds, respectively. AppManager computes the weighted average using the following formula, in which LP = lost packets and VT = voice time: 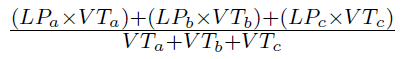
In the equation, the products of lost packets and voice time for each phone type are added together and then divided by the sum of the voice time values. In this example, the computed weighted average percentage of lost packets is 2.222. |
|
Maximum percentage of lost packets |
Maximum percentage of lost packets for each phone model |
AppManager finds the highest percentage of lost packets from all of the phone models you choose to monitor. For example, you choose to monitor three phone types. The total percentage of lost packets for type A is 3, for type B is 6, and for type C is 9. The highest of these three values is 9, which is the value represented by the data stream. |
|
Average listen MOS |
N/A |
AppManager converts the average R-factor value into MOS using a conversion formula provided by the ITU (International Telecommunications Union). |
|
Minimum listen MOS |
N/A |
AppManager converts the minimum R-factor value into MOS using a conversion formula provided by the ITU (International Telecommunications Union). |
|
Average listen R-factor |
An R-factor value for each phone model |
AppManager computes a weighted average of all the phone models you choose to monitor, based on the OM Report values for total voice time and R-factor. For example, you choose to monitor three phone types. The R-factor value for type A is 99, for type B is 97 and for type C is 95. The amount of voice time for the three phone types is 2, 3, and 4 seconds, respectively. AppManager computes the weighted average using the following formula, in which RF = R-factor and VT = voice time: 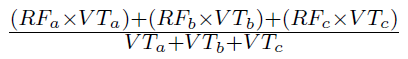
In the equation, the products of R-factor and voice time for each phone type are added together and then divided by the sum of the voice time values. In this example, the computed weighted average listen R-factor is 96.56. |
|
Minimum listen R-factor |
An R-factor value for each phone model |
AppManager finds the lowest R-factor value from all of the phone models you choose to monitor. For example, you choose to monitor three phone types. The R-factor value for type A is 99, for type B is 97 and for type C is 95. The lowest of these three values is 95, which is the value represented by the data stream. |
|
Total registration attempts |
A registration value for each phone model |
AppManager finds the total number of registration attempts from all of the phone models you choose to monitor. For example, you choose to monitor three phone types. The total number of registration attempts for type A is 3, for type B is 6, and for type C is 9. The total of these three values is 18, which is the value represented by the data stream. |
|
Total registration failures |
A registration value for each phone model |
AppManager finds the total number of registration failures from all of the phone models you choose to monitor. For example, you choose to monitor three phone types. The total number of registration failures for type A is 3, for type B is 6, and for type C is 9. The total of these three values is 18, which is the value represented by the data stream. |
|
Total unregistration attempts |
An unregistration value for each phone model |
AppManager finds the total number of unregistration attempts from all of the phone models you choose to monitor. For example, you choose to monitor three phone types. The total number of unregistration attempts for type A is 3, for type B is 6, and for type C is 9. The total of these three values is 18, which is the value represented by the data stream. |
|
Total voice time |
Total amount of voice time for each phone model. This value includes the voice time for both phase 1 and phase 2 phones. |
AppManager finds the total amount of voice time from all of the phone models you choose to monitor. For example, you choose to monitor three phone types. The total amount of voice time for type A is 20 seconds, for type B is 25, and for type C is 30. The total amount of these three values is 75, which is the value represented by the data stream. |