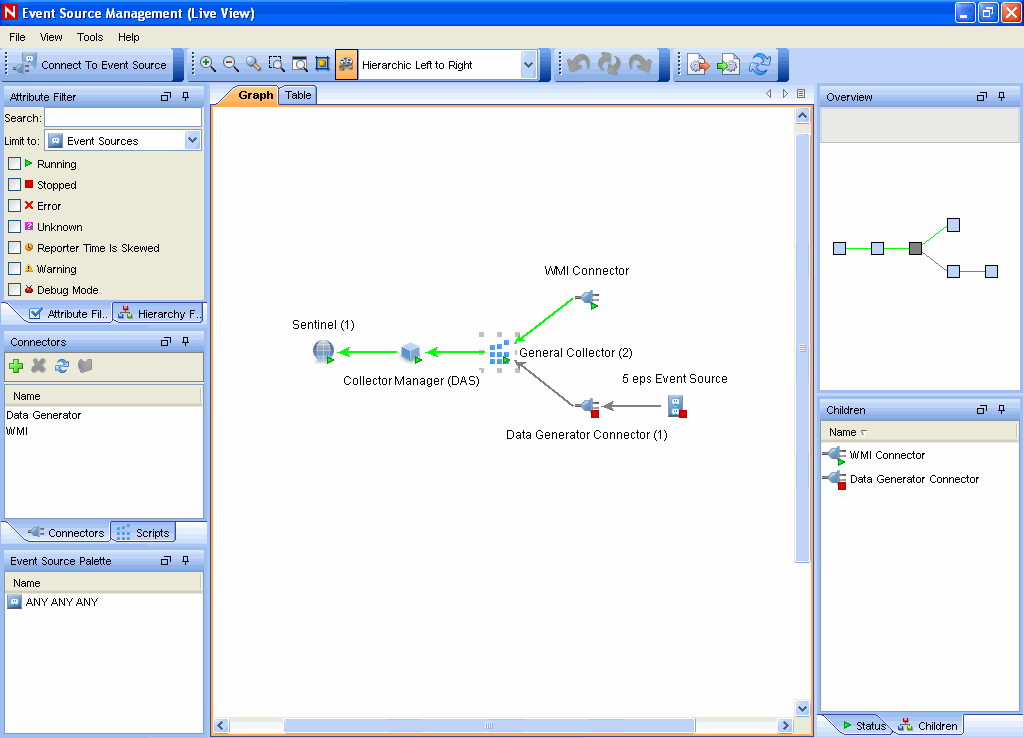
11.2 Introduction to the User Interface
The ESM Live View and Scratchpad are independent windows. This allows you to work on other tabs in Sentinel as you work on ESM.
The Event Source Management windows include:
-
A menu bar with the ESM menus
-
A toolbar that helps you execute the functions of ESM
-
Several different types of frames to display ESM data
-
A Display Health Monitor frame with graph and table views where you can perform your activities
Figure 11-1 Event Source Management Live View
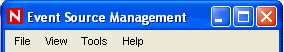
11.2.1 Menu Bar
The menu bar has , , , and options.
Figure 11-2 Event Source Management Menu Bar
The following are the options available in the each of the menu bar options that are described in the document:
-
-
-
-
-
-
-
Help
-
About
-
Help
-
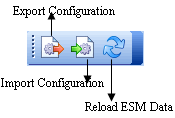
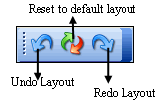
11.2.2 Toolbar
Table 11-1 Event Source Management User Interface
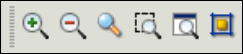
11.2.3 Zoom
In ESM, you can use magnifying glass to zoom into a region.
HINT:To enable or/ disable the magnifying glass in ESM, use the magnifying glass button on the toolbar.
You can increase or decrease the magnification factor with the following key combinations:
-
To increase the size of the size of the magnification glass cursor: Ctrl key + backward scrolling of the mouse wheel
-
To decrease the size of the size of the magnification glass cursor: Ctrl key + forward scrolling of the mouse wheel
-
To Zoom in: Forward movement of the mouse wheel
-
To Zoom out: Backward movement of the mouse wheel
NOTE:The magnifying glass is available only in the graphical view of the ESM window.
11.2.4 Frames
You can see the following frames in the Live View or Scratchpad window:
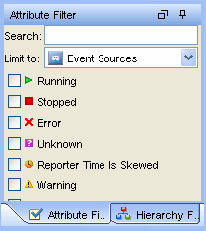
Attribute Filter
The Attribute filter allows you to display the components of ESM. You can specify the components to be displayed based on the component name and status.
Figure 11-3 Attribute Filter Frame
-
Text Filter: Allows you to filter the nodes that are displayed in the graphical and tabular view based on the text they type in.
-
State Filter: Allows you to filter the nodes that are displayed in the graphical and tabular view based on the current state of the node.
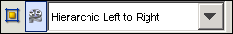
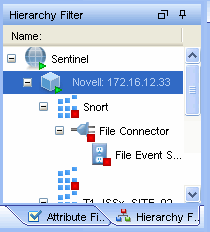
Hierarchy Filter
The Hierarchy filter sets the display based on the hierarchy you select in this frame. It allows the user to filter the nodes that are displayed in the graphical and tabular view based on the node hierarchy. All children and parents of selected nodes are shown.
Figure 11-4 Hierarchy Filter Frame
To set Hierarchy filter for displaying components:
-
In Sentinel Control Center, click in the menu bar and select .
-
Click the Hierarchy Filter frame.
-
Select the hierarchy level to display the components.
Connectors
Connectors are plug-ins in Sentinel. Importing a Connector implements the Connector mechanism in the system. The Connectors frame allows you to add, remove, and refresh Connectors and add auxiliary files in the system.
Figure 11-5 Connector Frame
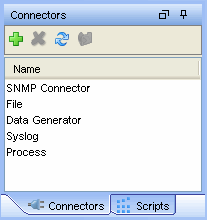
Table 11-2 Connector Frame Icons
|
Icon |
Name |
Description |
|---|---|---|

|
Add |
Adds Connectors to the system. |

|
Delete |
Deletes Connectors. |

|
Refresh |
Refreshes the list. |

|
Add Auxiliary Files |
Adds auxiliary files. For more information, see Add Auxiliary Files. |
To add Connector plug-ins:
-
In Sentinel Control Center, click in the menu bar and select .
-
Click the Script or Connectors frame. You can plug-in Connectors from here. For more information, see Adding Connectors/Collector Plug-Ins.
Scripts
Collectors are plug-ins in Sentinel. Collector plug-ins add the ability to parse raw data from a particular event source. The Scripts frame is used to manage the importing and updating of Collectors (also called scripts) into Sentinel.
Figure 11-6 Scripts Frame
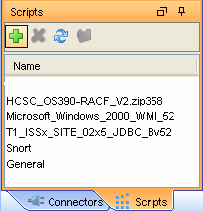
Table 11-3 Scripts Name Icons
|
Icon |
Name |
Description |
|---|---|---|

|
Add |
Adds scripts (Collectors) to the system. |

|
Delete |
Deletes Collectors. |

|
Refresh |
Refreshes the list. |

|
Add Auxiliary Files |
Adds auxiliary files. For more information, see Section 11.1.3, Auxiliary Files. |
To add Collector plug-ins:
-
In Sentinel Control Center, click in the menu bar and select .
-
Click the Script or Connectors frame. You can import Collectors from here. For more information, see Adding Connectors/Collector Plug-Ins.
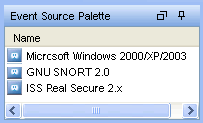
Event Source Palette
This frame displays the list of devices or event sources supported by the existing Collectors in the Central Repository. Each Collector ships with meta-information that describes the list of event source types supported by that Collector: This information is compiled to provide the data in this palette. The supported devices for a particular Collector might not necessarily be the same as the name of the Collector.
Figure 11-7 Event Source Palette
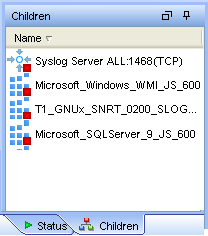
Children
This frame displays names of immediate children nodes of a parent (main) node when you click the parent node. This frame is useful for managing children of nodes that have been collapsed in the graphical view. To perform any action in ESM, right-click a component and select from options listed. For more information, see Section 11.3.3, Right-Click Menu.
Figure 11-8 Children Frame
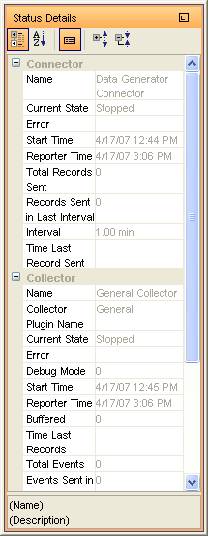
Status Details
This frame displays the status details of a selected component in the Health Monitor Display frame.
Available status information includes the current state, the number bytes processed, the number of records sent, the number of Sentinel events sent, and various other status and statistical information.
NOTE:The status information varies based on the type of component that is selected.
Figure 11-9 Status Details Frame
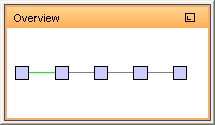
Overview
The Overview frame allows you to quickly move across the graphical view. This is particularly useful when there are many objects in the screen.
Figure 11-10 Overview Frame