11.4 Components of Event Source Hierarchy
ESM displays the information on the Collectors and other components in a hierarchy specific to ESM.
Figure 11-15 ESM Hierarchy
NOTE:ESM allows you to add Collectors, event sources, and Connectors.
Table 11-4 Components of the ESM Hierarchy


11.4.1 Component Status Indicators
Indicators are used to represent various states as follows:
Table 11-5 Component Status Indicators


To set an attribute filter for displaying components:
-
In the Sentinel Control Center, click in the menu bar and select or .
-
Click the Attribute Filter frame.
-
Specify the and criteria.
-
Select the or check box to specify the status of the components.
To hide components based on type:
-
In the Sentinel Control Center, click in the menu bar and select or .
-
Click the Attribute Filter frame.
-
Specify the and criteria.
-
Select the component type by which to limit the view.
11.4.2 Adding Components to the Event Source Hierarchy
Although some Sentinel components are preinstalled with the Sentinel system, Novell recommends that you check the Sentinel Content Web site for updated versions.
Collectors, Connectors and event sources can be added to the system through the right-click menus on the main ESM display.
11.4.3 Collectors
To run the Collectors and generate the events as per your requirements, you need to:
-
Download Collectors
-
Import and Deploy Collectors
-
Generate Events
Right-click the Collector and select Start to generate events.
-
Debug Collectors
For any errors in the output of a Collector, right-click the Collector and select .
For more information, see Section 11.5, Debugging.
-
Edit Collectors
To troubleshoot any problems with a Collector, you can edit the Collector. The method for editing the Collector depends on the type of Collector. For proprietary (or legacy) Collectors, copy the Collector script to a Windows machine that has Collector Builder installed. For JavaScript Collectors, any standard development environment for JavaScript can be used.
For more information on editing Collectors, see the Sentinel Collector SDK.
-
Re-Import and deploy Collectors
Adding Connectors/Collector Plug-Ins
NOTE:When you use the Sentinel Control Center to browse to locate a file on the Desktop of the Collector Manager, clicking takes you to the desktop of the user running the Collector Manager, usually SYSTEM. Extra steps might be necessary to navigate to the correct user’s desktop.
To add a Connector:
-
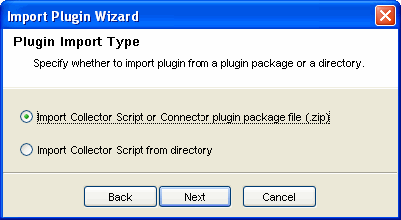
Click on the menu bar and select . The Import Plugin Wizard window displays.

-
Select . Click .
-
Browse to the location of the Connector plugin package file and click , then click .
If the file imported is not in the format specified for the Collector scripts or for the Connector plug-in package, the system displays an error message.
Plug-in details window displays.
-
Select the option to deploy the plug-in from this window.
-
Click .
When you add a plug-in into Sentinel, it is placed in the Plugin Repository, that enables Sentinel components on other machines to start using the plug-in without adding the plug-in separately.
To add a Collector plug-in:
-
Click on the menu bar and select . The Import Plugin Wizard window displays.

You can select from the two options available in this window.
-
Click
-
Do one of the following:
-
If you chose the first option, browse to a location of the Collector script file and click ., then click Next.
-
If you chose second option, you are directed to the Collector workspace. Select a Collector script directory and click .
The Collector Script Detail window displays.
-
-
Click the button next to the field to generate UUID.
The name and author details are displayed.
-
Edit the details as per your requirements. Specify a Version number.
-
Browse to and attach the help file.
If the help file is not in the plug-in directory, the system prompts you to copy the help file to the plug-in directory before the import. Click .
-
Provide a description and click . The Supported Devices window displays.
You must specify at least one device.
-
Click . The Supported Devices window displays.
-
Provide a vendor, name, version, description, click , then click .
Use the button to edit the details of a device or use the button to delete a device from the list. The Plugin details window displays.
-
Select the option to deploy the plug-in from this window.
-
Click .
Updating Connector/Collector Plug-Ins
If a new version of a Connector or Collector is released, you can update the Sentinel system and any deployed instances of the Connector or Collector.
NOTE:When you use the Sentinel Control Center to browse to locate a file on the desktop of the Collector Manager, clicking takes you to the desktop of the user running the Collector Manager, usually SYSTEM. Extra steps might be necessary to navigate to the correct user’s desktop.
To update a Connector or Collector plug-in:
-
Click and select . The Import Plugin Wizard window displays.
-
Select from the two options available in this window. Click .
-
Browse to a location of the Connector or Collector Plugin package file, select the file, click , then click .
If the file imported is not in the format specified for the Collector scripts or for the Connector plug-in package, system displays an error message.
-
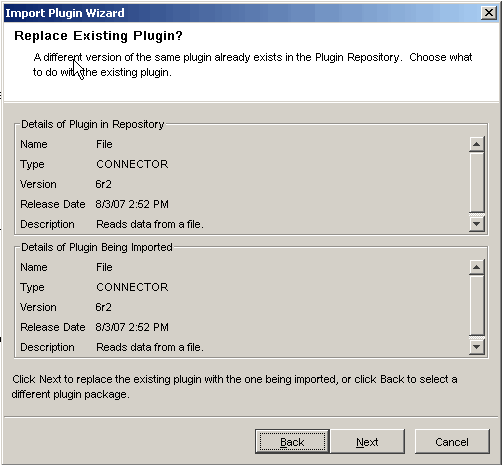
(Conditional) If you are updating an already-imported Connector or Collector, you are provided with the option of updating the existing plug-in, going back and selecting a different plug-in, or canceling the import. If you want to continue, click .
The Plugin details window displays.
-
Select the option to update any currently deployed plug-ins that use this Connector or Collector.
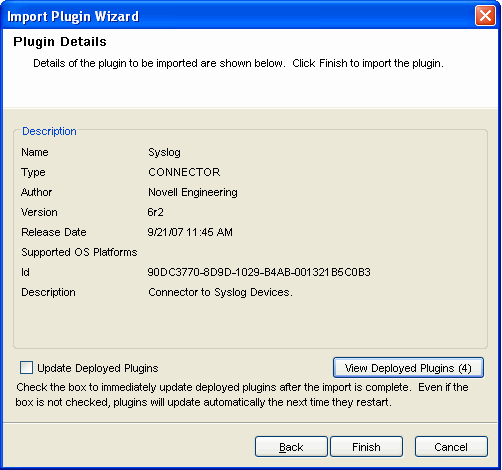
-
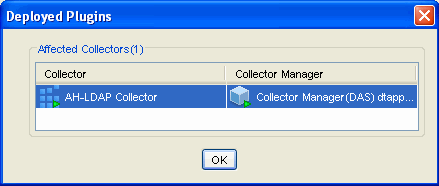
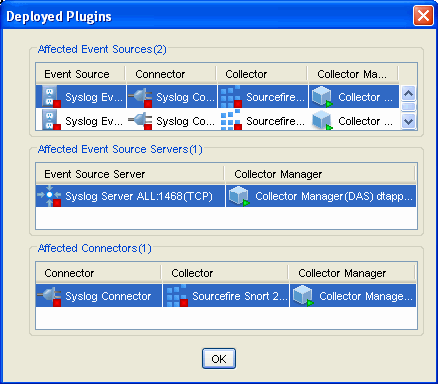
Click to view the plug-ins deployed in the .
The number in parentheses represents the number of instances of this plug-in that are currently deployed and configured. The Deployed Plugins window displays the Affected Connectors/Event Sources/Event Source Servers or Affected Collectors. These are the components whose configuration is affected because of adding already existing Connectors/Collectors in ESM.
-
Click .
NOTE:When you add a plug-in into Sentinel, it is placed in the Plugin Repository, which enables Sentinel components on other machines to start using the plug-in without adding the plug-in separately.
Deploying a Collector
-
In the main ESM display, locate the Collector Manager to which the new Collector is to be associated.
-
Right-click the Collector Manager and select the menu item.
-
Follow the prompts in the Add Collector Wizard.
-
Click.
NOTE:The Collector script enables the ESM panel to prompt you for parameter values as well as enabling ESM to automatically select supported connection methods that work well with the Collector script.
Deploying a Connector
-
In the main ESM display, locate the Collector to which the new Connector will be associated.
-
Right-click the Collector and select the menu item.
-
Follow the prompts in the Add Connector Wizard.
-
Click .
Deploying an Event Source
-
In the main ESM display, locate the Connector to which the new event source will be associated.
-
Right-click the Connector and select the menu item.
-
Follow the prompts in the Add Event Source Wizard.
-
Click .
Deploying Event Source Servers
Certain event source Connectors (such as the Syslog Connector) require a process to collect data from the actual data source. These processes are called event source servers. They collect data from the data source and then serve it to the event source Connector. Event source servers must be added and associated to any event source Connectors that require a server.
-
In the Live View, right-click the Collector Manager and select . The Select Connector window displays.
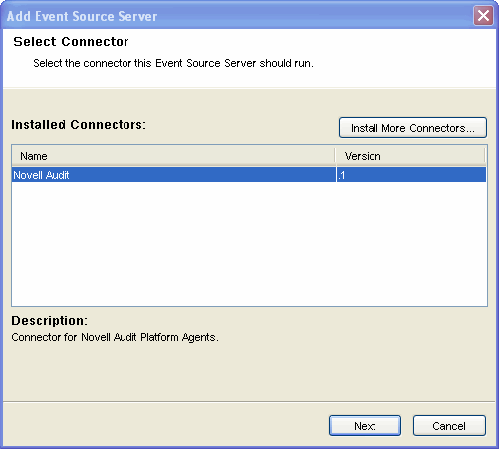
To start the Add Event Source Server Wizard, locate the Collector Manager on which the event source server process runs.
-
Select a Connector to support your device and click . If you do not have any Connectors in the list to support your device, click .
For more information on installing a Connector, see Adding Connectors/Collector Plug-Ins.
-
Configure the various parameters for the server with reference to the Connector selected (For example, Syslog Connector, NAudit Connector, and so on.). The configurable parameters are different for the different Connector types.
-
Click .
-
Provide a name for the event source server. If you want this server to be running, select the check box.
-
Click .
In the Health Monitor Display frame, the event source server added here displays with a dashed blue line showing the Collector Manager to which it is associated.
NOTE:This Add Event Source Server Wizard can also be initiated from within the Add Connector Wizard if a compatible event source server has not yet been added.
Connecting to an Event Source
There are several methods to configure an event source. Event sources can be deployed by right-clicking on an existing Collector Manager, Collector, or Connectors.
To deploy an event source, you need the following components:
-
Collector Script: Collector scripts can be downloaded from the Sentinel Content Web site copied from a previous Sentinel implementation (4.x or 5.x), or built by using the Collector Builder.
-
Connector: A Connector can also be downloaded from the Sentinel Content Web site. There are also some Connectors included in the installed Sentinel system, but there might be more recent versions on the Web site.
-
Configuration information for the event source
To connect to the event sources:
-
Click on the menu bar and select Connect to Event Source. Alternatively, click the button on the toolbar. The Connect to Event Source window displays.
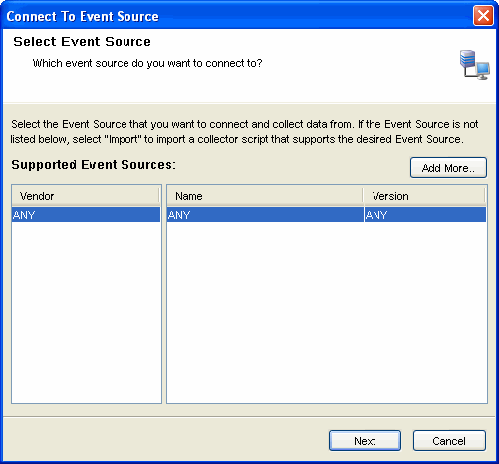
Event source types for which you currently have compatible Collector parsing scripts are listed here.
-
Select an event source from the list to which you want to connect to and collect data from. You can click to import an event source.
-
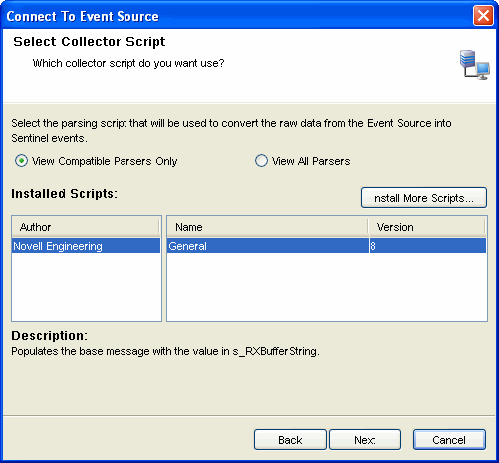
Click . Select Collector Script window displays.
You can open the Select Collector Script window by double-clicking or dragging a selected event source from the Event Source Palette window.
-
Select a Collector script from the list.
You can also install additional Collector scripts (click Install More Scripts) that support your event source, if it is not listed here. For more information on installing a Collector script, see Adding Connectors/Collector Plug-Ins.
-
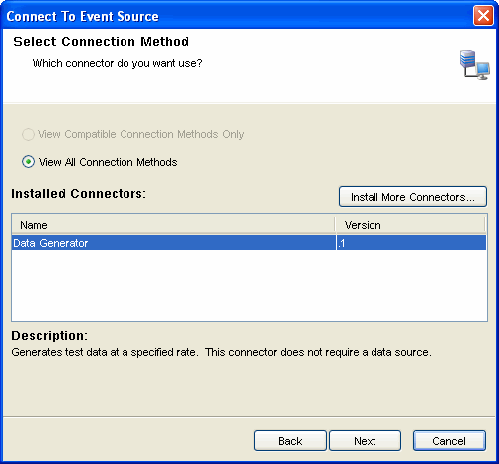
Click . The Select Connection Method window displays.
-
Select a connection method from the list.
You can also install additional Connectors by clicking on the Install More Connectors button. For more information, see Adding Connectors/Collector Plug-Ins to install Connectors.
-
Click .The Event Source Management window displays.
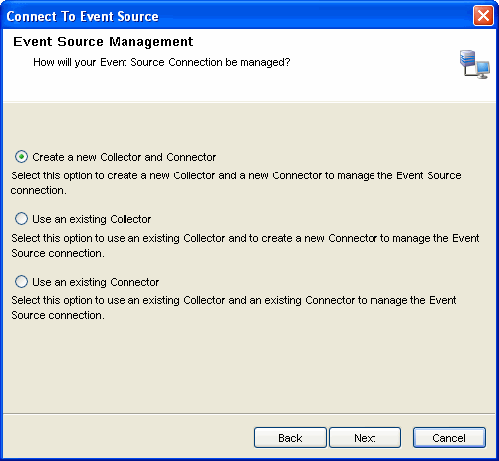
You can create a new Collector and Connector or you can use an existing Collector or Connector.
-
Select an option and click .
Based on the existing Collectors and Connectors in your system that is compatible with your new event source, one or more of these options might be unavailable.
-
Complete the configuration and click .
The Records Per Second window displays.
-
Set the number of records to be transferred per second and click .
The General window displays.
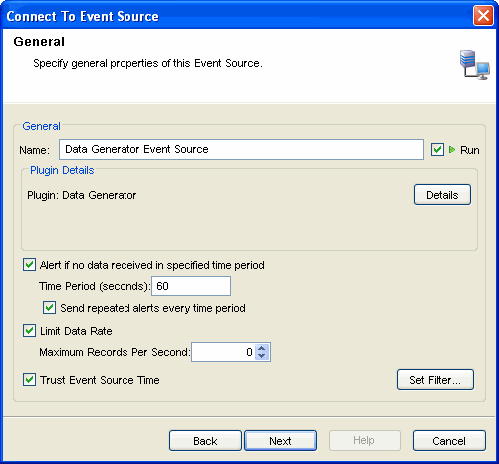
-
Click . The Summary window displays.
-
Click to test the event source.
The Test Event Source window displays with Data and Error tabs. The tab displays the error message if there is any error in the configuration of event source.
After a few seconds, a sampling of raw data should be received from the event source and displayed in the tab.
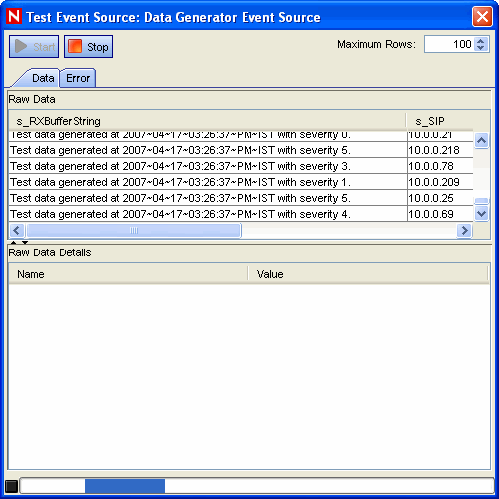
-
Click the and buttons to start or stop the test.
Use the Maximum Rows component to control the maximum number of raw data records to obtain at once.
-
-
Click .
NOTE:The Collector parsing script is executed on the same system as the Collector Manager that you select here.
Creating a new Collector and Connector
-
In the Select Collector Manager window, select the Collector Manager you want to use and click .The Configure Collector Property window displays.
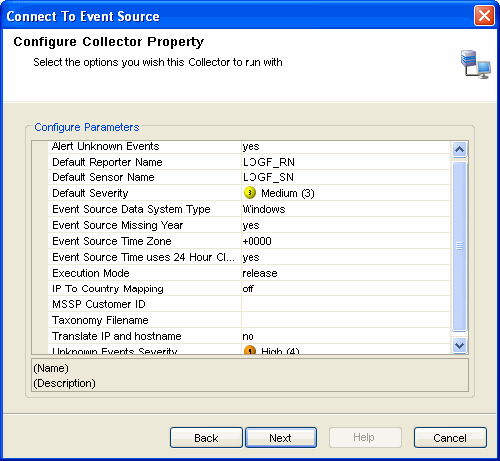
-
Configure the parameters available and click . The Configure Collector window displays.
-
Provide the name of the Collector and configure the options as desired:
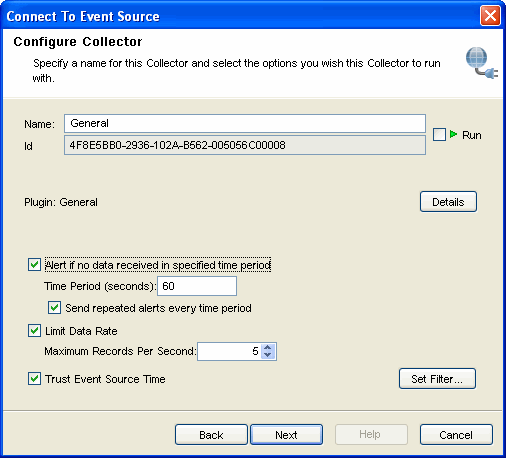
If the Trust Event Source Time option is selected, then all data flowing through the Collector has its Event Source Time trusted even if the event sources do not have this option selected.
-
Click . The Configure Connector window displays.
-
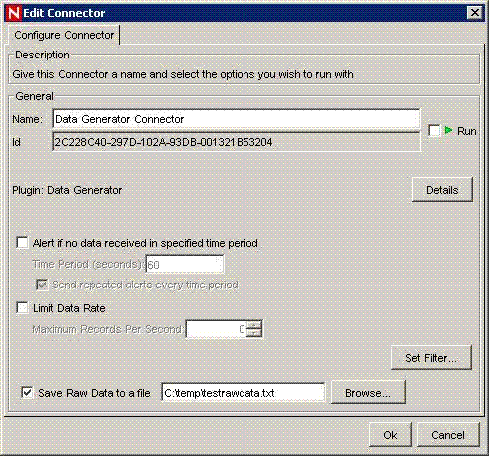
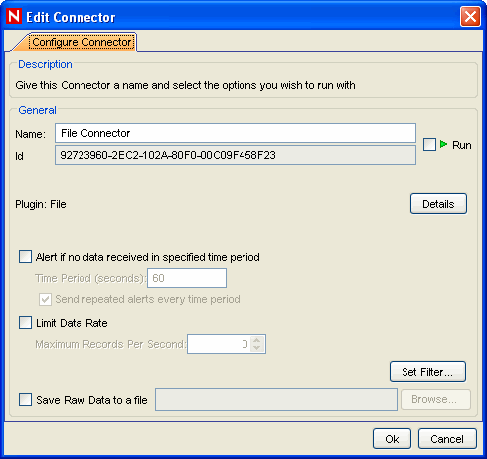
Provide the name of the Connector and configure the options as desired:
-
Click . The Event Source Configuration window displays.
-
Continue with Step 9.
Using an existing Collector:
-
Select this option to use an existing Collector and to create a new Connector to manage the event source connection.
After you select this option and click , the Select Collector window displays.
-
Select the Collector you want to use and click . The Configure Connector window displays.
-
Provide the name of the Connector and configure the options as desired:
-
Click .The Event Source Configuration window displays.
-
Continue with Step 9.
Using an Existing Connector
-
Select this option to use an existing Collector and an existing Connector to manage the event source connection.
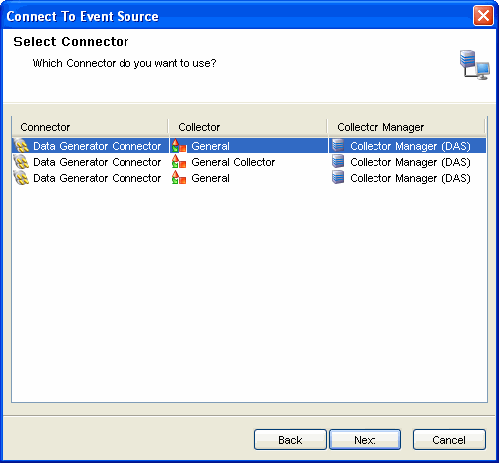
After you select this option and click , the Select Connector window displays.
-
Select the Connector you want to use and click .
-
Continue with Step 9.