11.5 Debugging
Sentinel's Collectors are designed to be easily customizable and to be created by customers and partners. There are two types of Sentinel Collectors: proprietary (or legacy) Collectors that are written in a language developed for Sentinel, and JavaScript Collectors. The debugging interface is slightly different for each type, and is intended to analyze the Collector code running in place on the Collector Manager For more information on customizing or creating new Collectors, obtain the Novell Developer Kit for Sentinel.
11.5.1 Collector Workspace and Collector Directory
Collectors are simple textual scripts that are run by a Collector Manager. The handling of these scripts is a bit complex:
-
The code for all Collectors is stored in a Plugin Repository on the central Sentinel server when they are imported.
Location: <Install Directory>\data\plugin_repository on the Sentinel server.
-
The runtime configuration for the Collector (when it is configured to run on a particular Collector Manager) is stored separately in the Sentinel database.
-
When a Collector is actually started on the Collector Manager, the Collector plug-in is deployed to the Collector Manager in real time, the runtime configuration is applied, and the code is started. Any preexisting instance of the Collector code on that Collector Manager is overwritten.
Location: <Install Directory>\data\collector_mgr.cache\collector_instances on each Collector Manager.
-
In order to edit a Collector, you need to use the ESM Debuggger button, which copies the Collector to the local Collector Workspace on the client machine (the machine where you are running SCC). Edits are made against that local copy and then uploaded back into the central Plugin Repository.
Location: <Install Directory>\data\collector_workspace on the client application machine.
11.5.2 Debugging Proprietary Collectors
The Debugging Collector window allows you to debug Collectors written in the Novell proprietary language. The left column on the debugger displays the commands for the current script state. The highlighted command is being executed.
The right column on the debugger displays the script’s variables and their current value. The variable list expands as all the script’s variables are used. The variables are color-coded to show new variables in blue, changed variables in red, and variables whose value has not changed since the last step as black.
Figure 11-16 Debug Collector Window
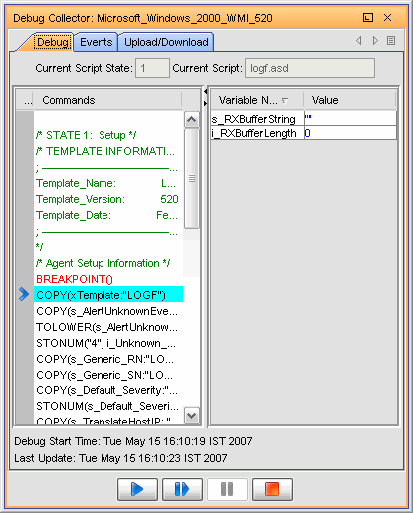
The tab displays the events generated using this Collector, and the / tab allows you to upload/download another Collector script file to make modifications.
The debugger has the following four controls:
Table 11-6 Debugger Icons
|
Icon |
Action |
Description |
|---|---|---|

|
|
Runs the script until the next breakpoint is encountered. |

|
|
Proceeds one instruction at a time. |

|
|
Pauses the running script. |

|
|
Stops the script. |
The list and the list are not displayed in the debugger when the script is running. To see the list and the list, the debugger must be Stepping, Paused, or Stopped.
You can view events as well as upload and download the Collector’s script from the tab and the / tab.
Multiple Sentinel Control Center users might connect to the same debugging session. For this reason, a Collector remains in Debug mode until one of the users specifically clicks the debugger’s button.
To debug a Collector:
-
In the main ESM display, locate the Collector that you want to debug.
-
Right-click the Collector and select .
-
In the Debug Collector window, select a variable from the list of variables in the right pane, then click the button.
-
After debugging all the variables, close the Debug window.
-
Start the Collector to generate the events.
11.5.3 Debugging JavaScript Collectors
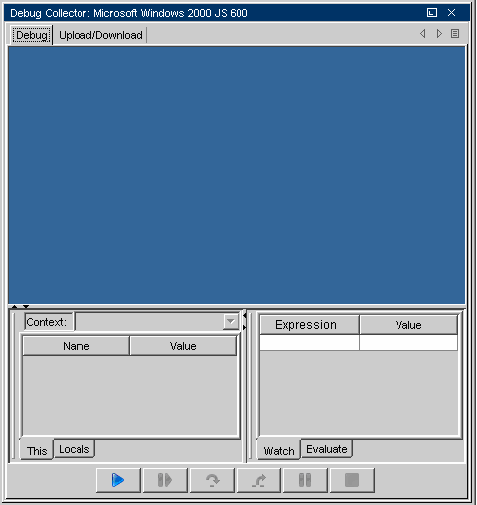
The debugger for JavaScript Collectors can be used to debug any JavaScript Collector.
Accessing the Debugger
The JavaScript debugger is launched the same way the debugger for proprietary Collectors is launched.
-
Debug: Launches the JavaScript file in this window.
-
Upload/Download: Upload/Download a JavaScript file here. You can download an existing JavaScript file, edit it, and upload it again into the system to continue debugging.
-
Context: Displays the variable that the debugger is pointing to and its value.
-
Expression: Displays the values of a selected parameter.
You can use the following when debugging a Collector.


Hot Keys
When the source code window is on focus in the debugger, you can use the following hot keys:
-
Use Ctrl+F to find a string in the source code.
-
Use Ctrl+G to go to a line number.
-
Use Ctrl+M to find the parenthesis or brace that matches the highlighted one.
You can also open a script file, set a break point, step through the script code, and watch variable and method values at each step.
You can debug Collectors in Standalone or Connected modes.
Debugging a Collector
-
Log into Sentinel Control Center. On the menu bar, click .
-
Right-click the Collector and stop the Collector if it is running.
-
Right-click the Collector and select .
The Debug Mode Selection window displays.
You can choose to debug in Standalone or Live mode.
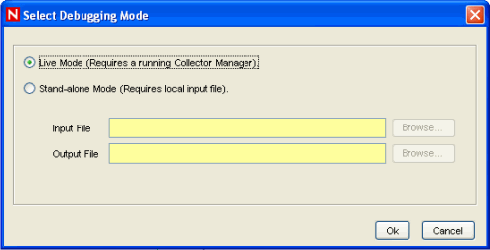
Standalone Mode
Standalone debug mode allows you to debug a Collector even if the associated Collector Manager is not running.
For standalone mode, input to the script comes from an input file rather than a live event source. Specify the path to a raw data file that will be used as input. For Collectors that use a DB Connector, the input file should be a text file with log data in NVP format. For Collectors that use a File Connector, the input should be a text file with log data in CSV format.
For standalone mode, output from the script is to an output file rather than live events. You must specify the path to the output file that the script uses for output. If you specify an output file that does not exist, the system creates the file for you
-
Select Standalone mode, then stop the Collector.
The Collector Manager does not need to be up and running, and the events do not display in the Active Views.
-
Specify the path for the input and output files.
If you specify an output file that does not exist, the system creates the file for you.
-
Click . The Debug Collector window displays.
-
In the Debug Collector window, click
 .
.
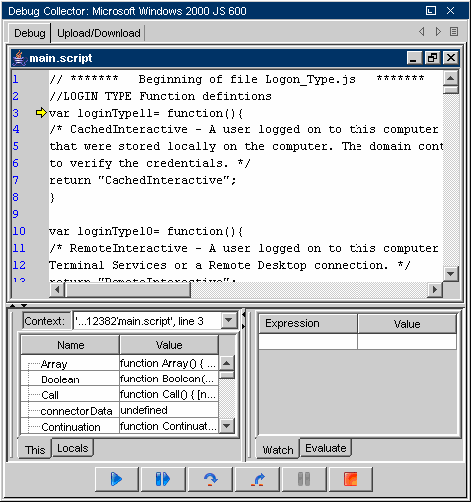
In the Source text area, the source code of the Collector appears and stops at the first line of the text script.
-
Click the bar on the left and toggle a breakpoint in the script code, then click
 to go to the next breakpoint.
Click
 to pause debugging whenever required.
-
After debugging is complete, click
 to stop debugging.
-
Click the / tab in the debugger window.
-
Click and specify a location to download the script file.
-
Open the file with any JavaScript editor or a text editor.
Make your edits in the code and save the file, then click .
Debug the uploaded script to have a Collector script ready to use.
Live Mode
-
Live debug mode requires that the Collector Manager associated with the Collector is running.
-
In Live debug mode, Input to the script comes from actual event sources connected to the Collector. To get data from a specific event source, you must right-click and start the desired event source via the ESM display. Starting/stopping event sources can be done any time during the debug session.
NOTE:If no event source is started during the debug session, then no data is available in the buffer for the Collector and you see the Collector script’s readData method blocking.
-
In Live debug mode, Output from the script is via live Sentinel events. The events can be viewed on the Active Views displays.
NOTE:When in Live debug mode, the script engine is executed on the local box rather than the actual box that the associated Collector Manager is running on. The Connectors/event sources still run on the same box as the Collector Manager. When running debug mode, data is automatically routed from the event sources to the script engine running in debug mode on the local box.
11.5.4 Using the Raw Data Tap to Generate a Flat File
When debugging, it might occasionally be helpful to view Connector output data. In addition to viewing raw data from the Connector by using the right-click option for nodes in the Sentinel Control Center, Sentinel also includes an option to save the raw data from a Connector to a file for further analysis.
To save raw data from a deployed Connector to a file:
-
Right-click the Connector node and select . The Edit Connector dialog box displays.
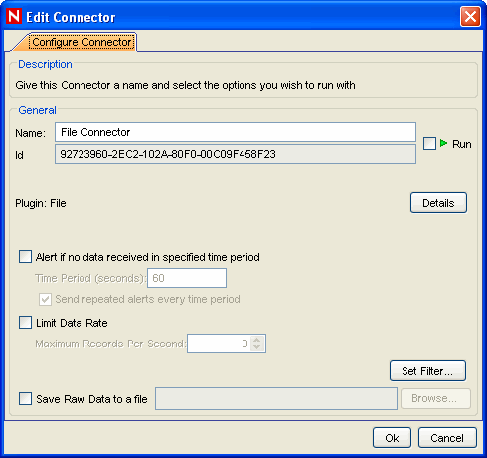
-
Select .
-
Specify a path on the Collector Manager machine where the raw data is saved.
-
Click .
IMPORTANT:The account running the Sentinel service on the Collector Manager machine must have permissions to write to the file location.