11.10 Report Data Configuration
NOTE:In order to use Report Data Configuration, your configuration.xml file must be pointing to a Communication Server that has DAS_Binary and DAS_Query connected to it. This will normally be the case, by default, as long as the Communication Server and DAS processes are running.
The Report Data Configuration option allows you to enable and disable summaries, or aggregate tables in the Sentinel database. Enabling a summary allows aggregation to start computing the counts for that particular summary and will shorten the execution time for any report that uses the summary table. Sentinel Top 10 reports use summary tables.
A summary is a defined set of attributes that make up the key for which to compute the number of unique occurrences (event count) by each hour time period (event time). In the case of the EventSevDestPortSummary, when active, it saves the count of events for each unique combination of destination port and severity for an hour time frame. These saved computations of the event data allow for quicker summary reporting and querying. These reports are used by Crystal Reports Server. For more information, see Crystal Reports for Windows
and Crystal Reports for Linux
in the Sentinel 6.1 Installation Guide. Certain summaries will need to be active in order for the summary reports to be accurate.
Aggregation is the process of calculating the running count for all active summaries as events flow through the system. These running counts are saved to the database in the respective summary tables.
Summaries Benefits:
-
Greatly reduced event data set
-
Conformed dimensions that allow the ability to drill-down, roll-up and drill-across on event data
-
Summary reports run much faster with pre-computed summaries
Aggregation Benefits:
-
Only processes active summaries
-
Does not affect event insertion into the real time database.
Report Data Configuration tab allows you to:
-
enable/disable any predefined summaries
-
view attributes of each summary
-
see the validity of a summary for a timeframe
-
query which eventfiles need to be run so that the summary is complete
The following are all summaries already defined in the system. It lists the summary name, database table name and it’s attributes in a brief description about the summary.
Table 11-2 Summary Name description
To disable/enable Summary:
-
Click Report Data Configuration in the navigation pane or click Report Data Configuration button.
-
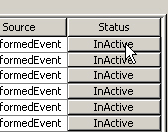
To disable a summary, click Active in the Status column until it changes to say InActive.
-
To enable a summary, click InActive in the Status column until it changes to say Active.
To enable Aggregation for Top 10 reports for Crystal Reports Server:
Enable the following three summaries:
-
EventDestSummary
-
EventSevSummary
-
EventSrcSummary
Enable EventFileRedirectService in the das_binary.xml located:
For UNIX:
$ESEC_HOME/config/das_binary.xml
For Windows:
%ESEC_HOME%\config\das_binary.xml
NOTE:To enable the summary you must set the property “Status” to ON for EventFileRedirect in das_binary.xml
-
To view information for a Summary:
-
Click Report Data Configuration in the navigation pane or click the Report Data Configuration button.
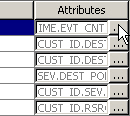
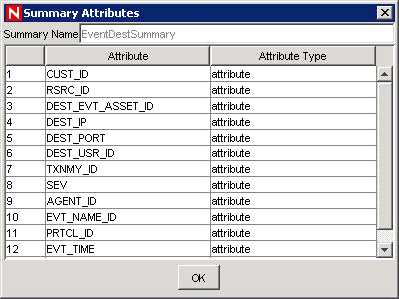
-
Click the … button in the Attributes column to see the attributes that makes up a summary.
To check the Validity of a summary:
-
Click Report Data Configuration in the navigation pane or click the Report Data Configuration button.
-
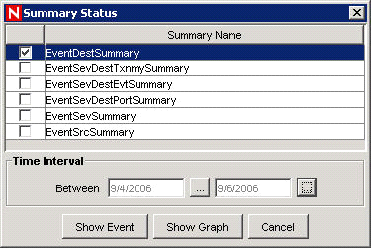
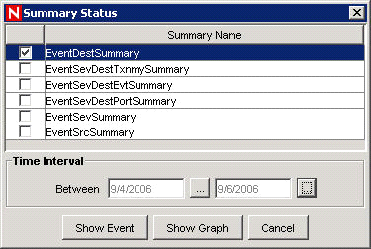
Select Status.
-
Select the summary or summaries you want to query.
-
Select a time interval.
-
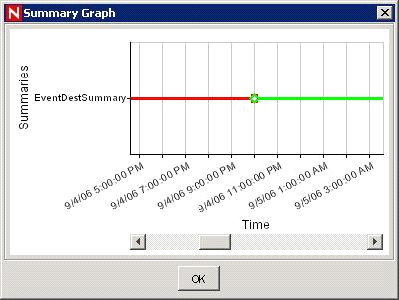
Click Show Graph.
-
The green bars signify that the summary is complete for that time frame. The red sections signify that the summary is missing data during that time period.
NOTE:To complete summaries, see To run Eventfiles for a summary:.
To query the Eventfiles for a summary:
-
Click Report Data Configuration in the navigation pane or click the Report Data Configuration button.
-
Select Status.
-
Select the summary or summaries you want to query.
-
Select a time interval.
-
Click Show Event.
-
The Eventfiles needed to complete the summary displays in a list format.
NOTE:To complete summaries, see To run Eventfiles for a summary:.
To run Eventfiles for a summary:
-
Click Report Data Configuration in the navigation pane or click the Report Data Configuration button.
-
Select Status.
-
Select the Summary or Summaries you want to query.
-
Select a time interval.
-
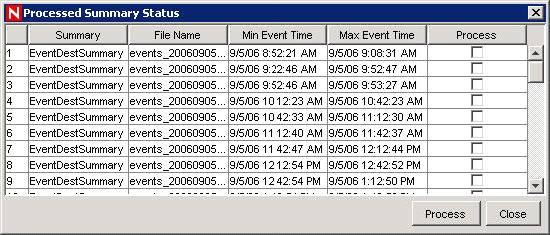
Click Show Event.
-
The Eventfiles needed to complete the summary displays in a list format.
-
Check the Eventfiles that you want to run so that the summary is complete.
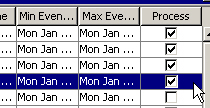
-
Click Process.