7.2 Introduction to the User Interface
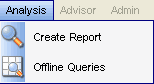
In Analysis, you can see the Create Reports and Offline Queries options.
You can navigate to these functions from:
Table 7-1 Analysis Tab -User Interface
|
The Analysis menu in the Menu Bar |
|
|
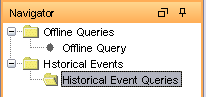
The Navigation Tree in the Navigation Pane |
|
|
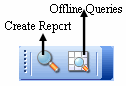
The Toolbar Buttons |
|
7.2.1 Top Ten Reports
The following are the Top 10 reports which are available in Sentinel 6:
-
Top 10 Correlation Rules Triggered
-
Top 10 Destination Host Names
-
Top 10 Destination IP Addresses
-
Top 10 Destination Port Numbers
-
Top 10 Destination User Names
-
Top 10 Destination Event Names
-
Top 10 Source Host Names
-
Top 10 Source IP Addresses
-
Top 10 Source to Destination IP Pairs
-
Top 10 Source User Names
-
Top 10 Virus Names
-
Event Count by Top 10 Assets
-
Event Count by Top 10 Departments
-
Event Count by Top 10 Taxonomy Level 3
-
Incidents by Top 10 Assets
-
Incidents by Top 10 Users
The Top 10 reports are enabled by default, and the following summaries are turned on to enable the Top 10 reports:
-
EventDestSummary
-
EventSevSummary
-
EventSrcSummary
If Top 10 reports are not needed, you can disable these summaries, or you can enable additional summaries in order to use them for reporting. If the summary service is not in use, you can disable it.
To enable/disable Aggregation:
-
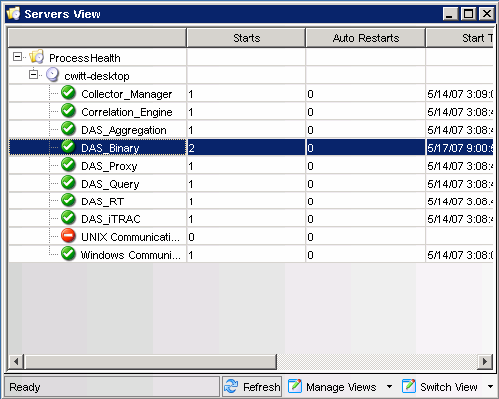
In Sentinel Control Center, go to Admin > Server Views.
-
Right-click DAS Aggregation and select Start/Stop to enable/disable Aggregation.
To enable/disable summaries:
-
In Sentinel Control Center, go to Admin > Report Data Configuration.
-
Highlight the Summary to enable/disable and click the status (Active/Inactive) of that summary.
-
Select Yes to confirm that you want to change the status of the summary.
To enable or disable EventFileRedirectSerice:
-
At your DAS machine, using text editor, open:
For UNIX:
$ESEC_HOME/config/das_binary.xml
For Windows:
%ESEC_HOME%\config\das_binary.xml
-
For EventFileRedirectService, change the status to on or off, as appropriate. For example:
<property name="status">off</property>
-
Log into the Sentinel Control Center as the Sentinel Administrator.
-
Go to Admin > Servers View.
-
Right-click DAS_Binary and select Restart.
7.2.2 Running a Report from Crystal Reports Server
To run a report:
-
Click the Analysis tab.
-
In the Analysis Navigator, click a report from the available reports.
NOTE:To run any Top 10 reports, aggregation must be enabled and EventFileRedirectService in DAS_Binary.xml must be set to on. For information on how to enable aggregation, see Section 11.10, Report Data Configuration.
-
Click Analysis > Create Report or click Create Report.

-
Complete the information prompts and click OK. The report displays.
7.2.3 Running an Event Query Report
To create an Event Query report:
-
Click the Analysis tab.
-
In the Analysis Navigator, open the Historical Events folder.
-
Click Historical Event Queries.
-
Click Analysis > Create Report or click Create Report icon. An Event Query window displays.
-
Set the following:
-
time frame
-
filter
-
severity level
-
batch size (this is the number of events to view – events display from oldest events to newer events)
-
-
Click Begin Searching.
-
To view the next batch of events, click More results icon.
-
Rearrange the columns by dragging and dropping them and arrange the sort order by clicking in the column heading.
-
When your query is complete, it is added to the list of quick queries in the Navigator.