4.2 Viewing and Editing Host Server Details
Review the following sections for information on the details views:
4.2.1 Accessing Host Server Details
The details for each host server consist of a summary, configuration information, monitoring information, and an event log.
-
In the VM Client, click the view.
The host servers are displayed:

-
Do one of the following:
-
Double-click one of the host servers.
-
Right-click one of the host servers, then select .
The tabs for the selected host are displayed.
-
-
For details on the tabs, see:
-
To close the details view, click the view name in the Inventory perspective panel.
4.2.2 Using the Details Tabs
The following sections provide information on the various details tabs:
Summary Tab
This details tab is used by each Inventory panel type:
Figure 4-1 Summary Tab for Host Servers
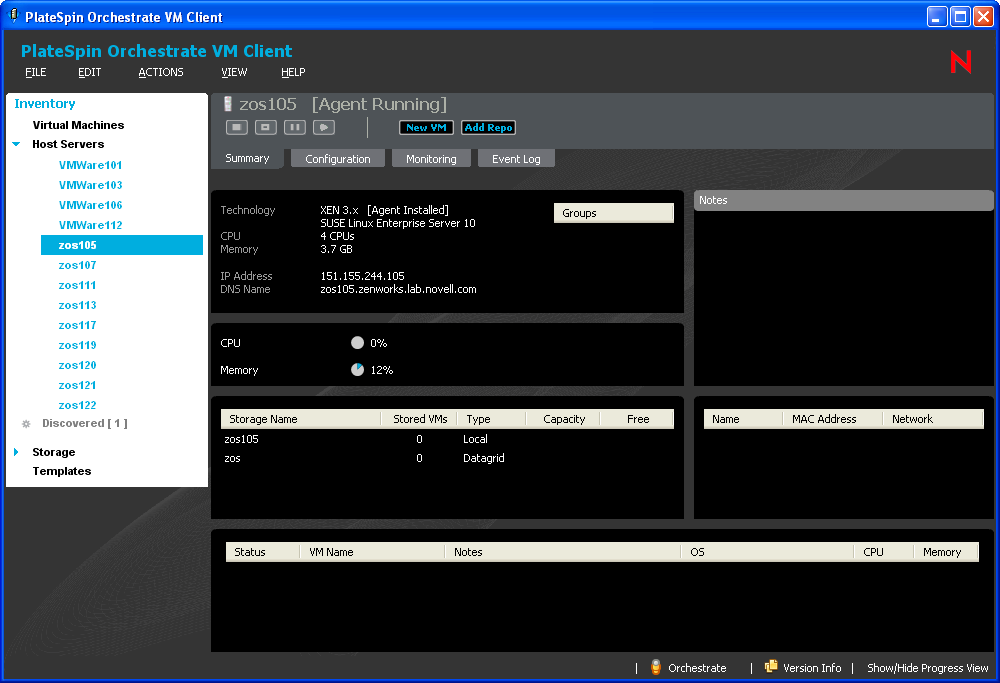
You can do the following with the tab for host servers:
-
In the first section, right-click a group name under Groups, then select to revoke the host server’s membership in the group.
-
In the Notes section, enter and edit notes for the host server.
-
View basic information about the host server, including:
-
The host server’s operating system
-
The virtual machine technology being used by the host server
-
Percentage of CPU and memory in use
-
IP address and DNS name, if it is not DHCP
-
Storage items being used by the host server, including how many VMs are using each repository, the type of network access to the repository, and each repository’s capacity and percent free
-
A list of VMs being hosted by this server
-
The host server’s MAC address
-
-
Right-click a listed storage item, then select either or .
-
Double-click a listed storage item to view its details tabs.
-
Right-click a listed VM, then select any of the available menu options. These are the same right-click menu options that are available for the VM in the Inventory list.
-
Double-click a listed VM to view its details tabs.
Wherever N/A appears in the details, it means that the information is not available.
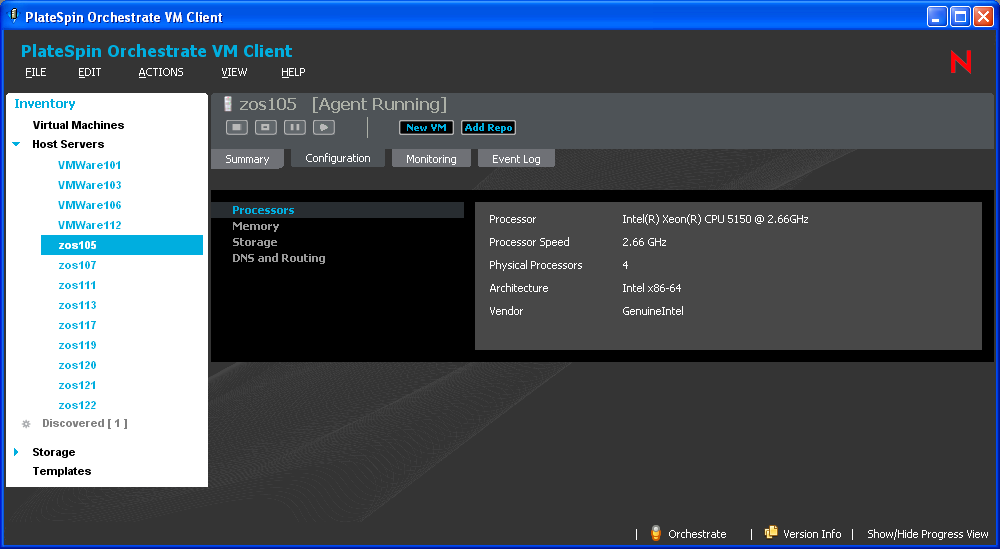
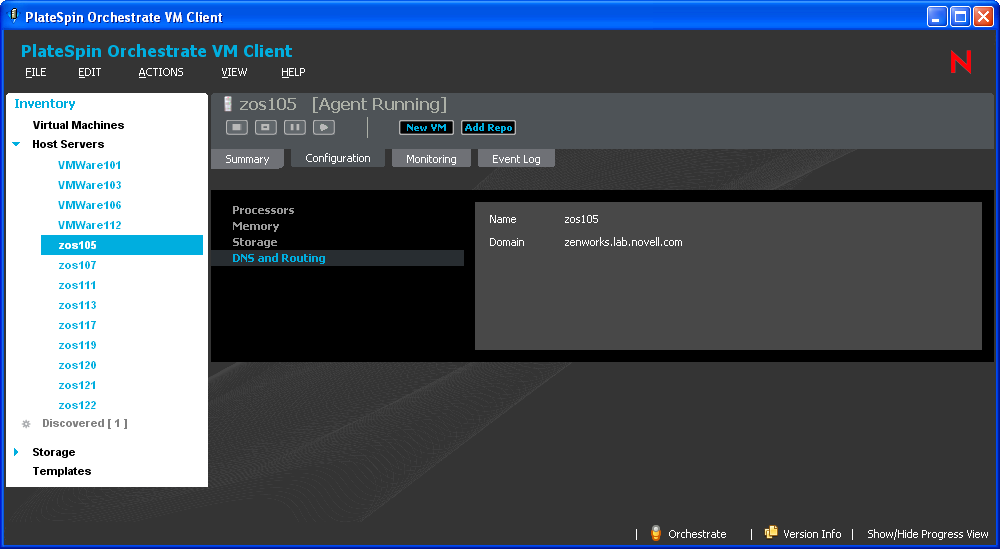
Configuration Tab
This details tab is used only by host servers. You use information available in the tab to effectively manage the existing VMs hosted on the VM hosts. For example, you can decide to stop a VM when the memory utilization is high. You can also effectively utilize the VM host by deploying additional VMs, if required, and you can install applications on the VMs.
You can do the following with this tab:
-
Click to view information about the processors on the host server. This is the default view:

-
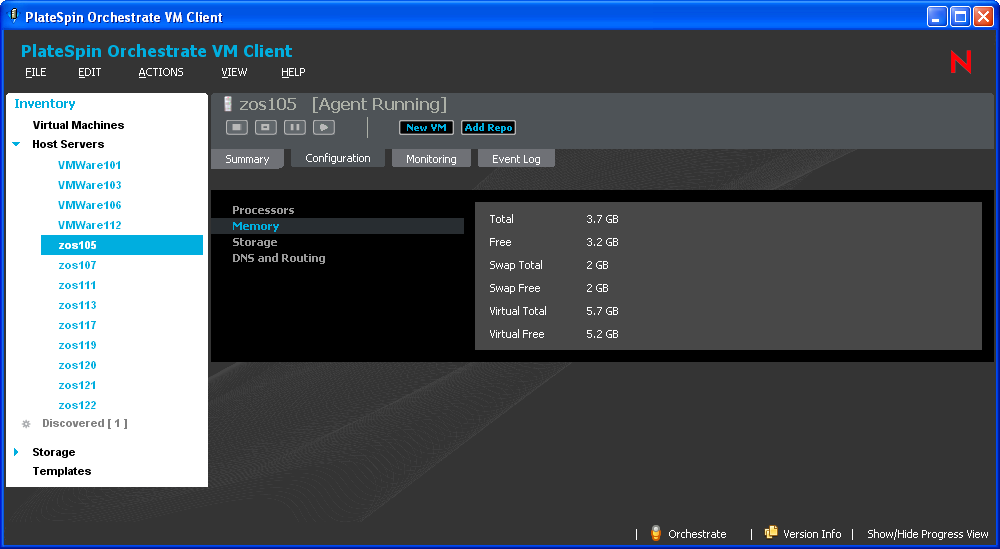
Click to view information about memory usage on the host server:
-
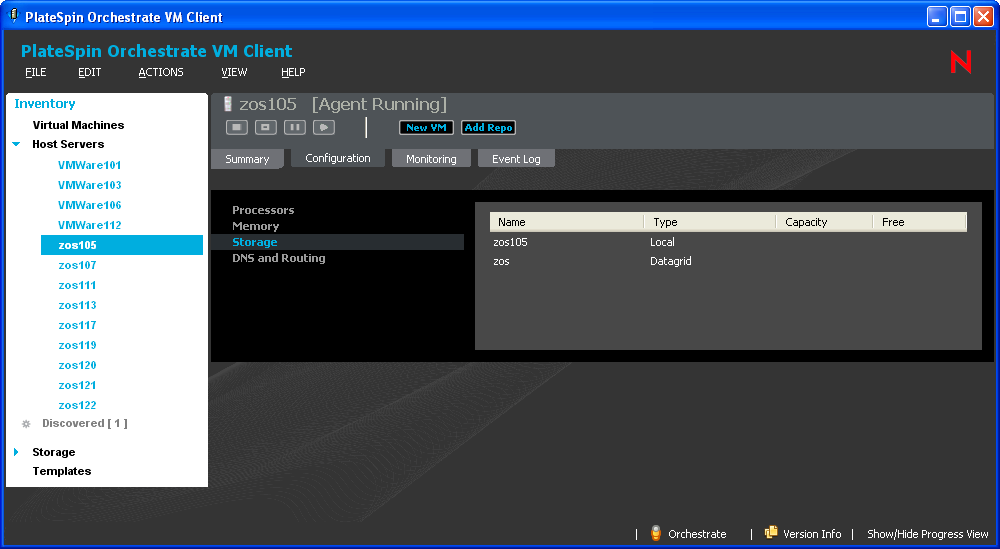
Click to view information about storage availability on the host server:
-
Click to view the computer name and domain name for the host server:
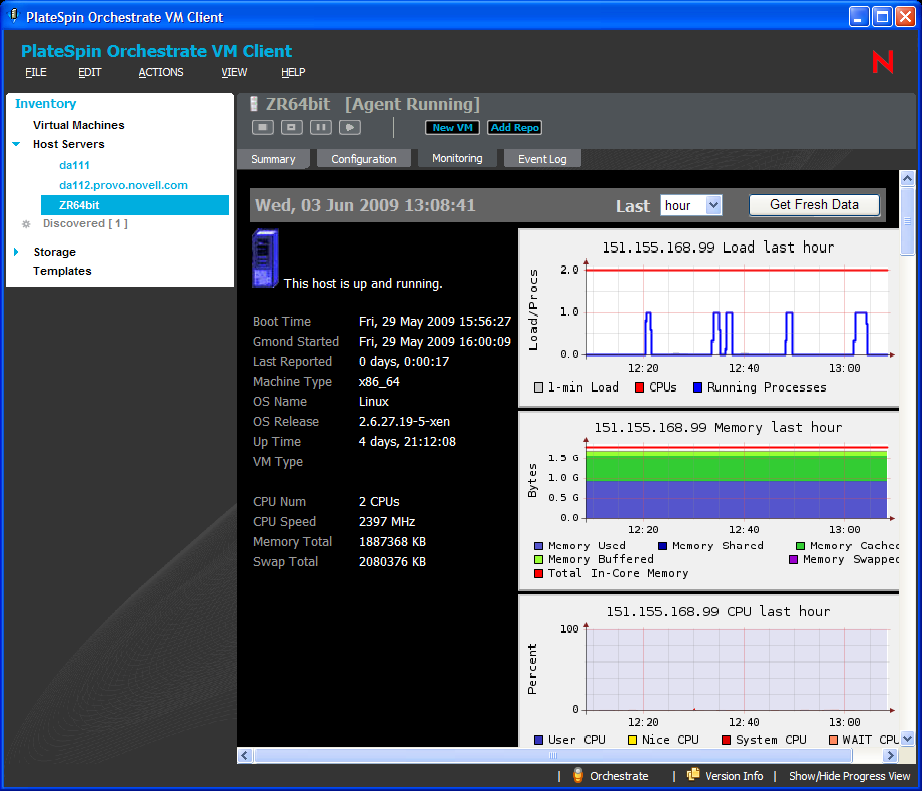
Monitoring Tab
This details tab allows you to monitor many elements of both the virtual machines and physical host machines, aiding you in the overall management of your data center.
The Monitoring Agent must be installed on the device in order for this tab to show any information. For instructions to install the agent manually, see Section 5.7, Installing the Monitoring Agent on a VM.
Review the following to understand the tab and how to access and use it:
Understanding Monitoring
The tab displays information about the VM or host server that you can use to monitor whether it is performing correctly, is overused or underused, its history, and details about its capacities.
The default window size for the VM Client only allows one column of graphics to be displayed. The following is an example of the tab’s information:
Figure 4-2 Monitoring Tab for a Host Server Showing Default Single Column View of Graphics
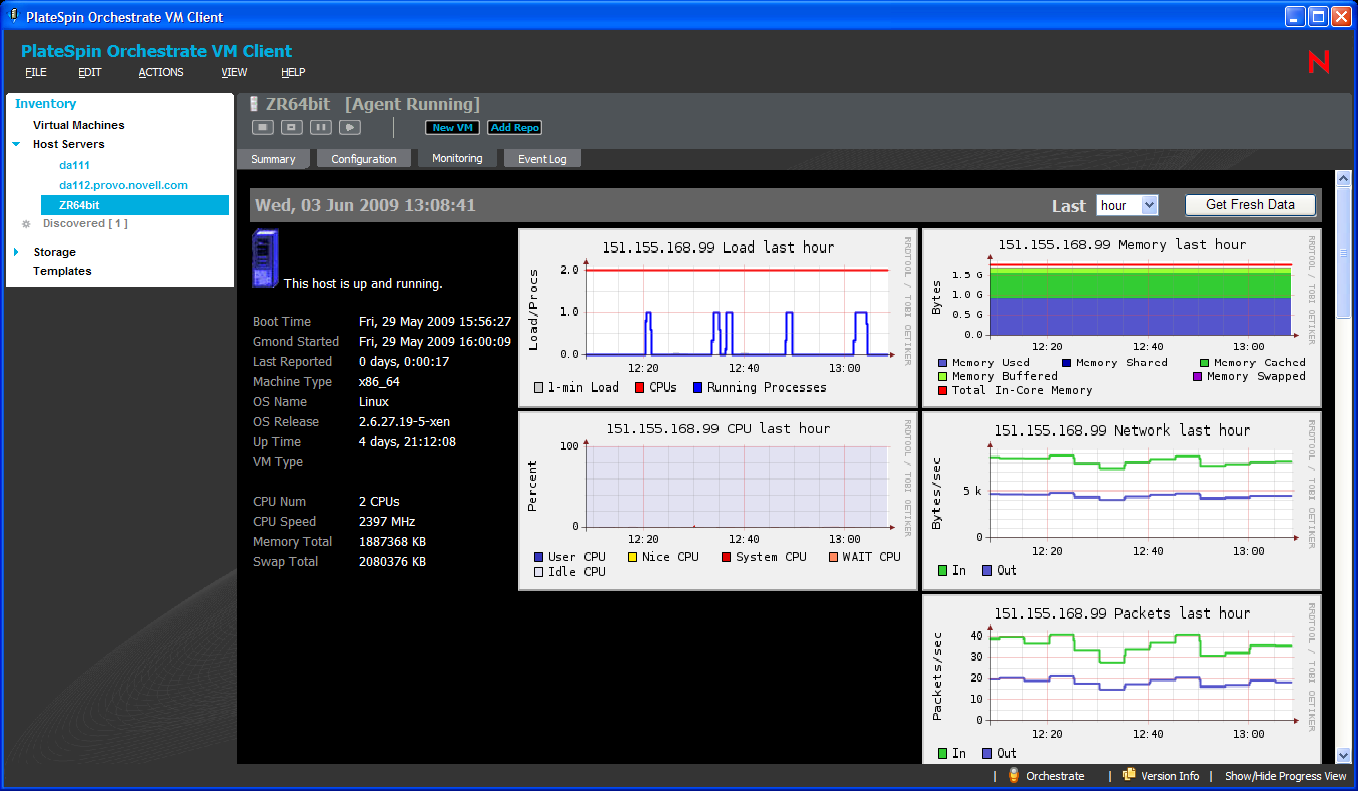
The following example shows that graphics can be displayed side-by-side when you expand the width of the VM Client window.
Figure 4-3 Monitoring Tab for a Host Server Showing Multiple Column View of Graphics
Monitoring VMs and Host Servers
-
In the VM Client, click the view or the view, then double-click a VM or host server that you want to monitor.
Wherever N/A appears in the details, it means that this information is not available.
-
Click the tab to display the view.
-
If you are requested to provide credentials, enter the Monitoring login name and password.
-
To set the time interval for which you want the data displayed (hour/day/week/month/year), go to the field and select the time from the drop-down options.
-
To maximize the tab view in the VM Client window, double-click the VM or Host name located in the Inventory item’s title area just above the action buttons:

The following illustrates the tab maximized in the VM Client Window:

Double-click the item’s title again to return the tab to its previous view.
-
To refresh the graphics, click the button.
You can refresh the view at any time.
Event Log Tab
This details tab is used by VMs and host servers:
Figure 4-4 Event Log Tab for VMs
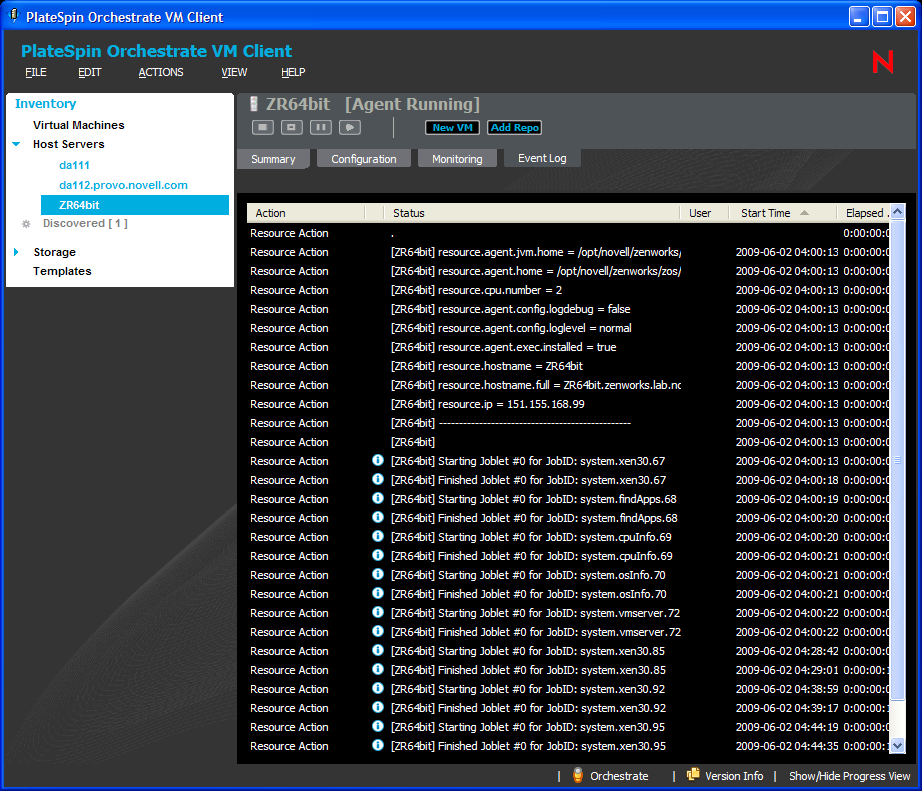
This tab provides information from both the resource log messages and the action status history log, intermingled based on start times. Therefore, the log provides both information on the host server as well as actions for any VMs it is currently hosting. Double-click the ![]() icon to display the host’s Event Log Details dialog box.
icon to display the host’s Event Log Details dialog box.
You can do the following with this tab:
-
View the Event Log information.
-
Double-click an event item that contains the
 icon to view the details of the event as reported by the Orchestrate Server. The following is an example of an event’s details:
