2.0 Understanding the Operations Center Console
The Operations Center console acts as a business service control center for exploring, navigating, and managing various business-related elements and views. It provides a hierarchical tree view of system objects as well as a type of Service Dashboard consisting of six different views.
Figure 2-1 The Operations Center Console
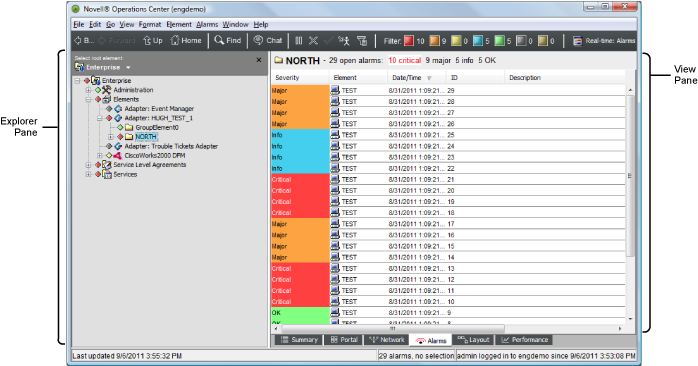
The console provides an interface for viewing, navigating, and managing network organizations. It consists of two main panes:
-
Explorer (left pane): Lists system elements in a hierarchical tree. The Explorer pane functions as one of the main controllers for the console by allowing you to navigate element hierarchies, view element information and perform operations.
For details on the Explorer pane, see Section 2.4, Navigating Element Hierarchies
-
View (right pane): Depending on the selected view, the console displays various types of information about the selected element or the element’s children.
For details on the Explorer pane, see Section 2.1, Console Views and Section 2.2, Navigating Console Views.
The type of information displayed in the pane varies depending on the selected tab:
-
Summary: View a listing of first-level child elements with status information including current condition, alarm totals, and last reported date/time.
-
Portal: Administrators can perform multiple functions from this view that contains multiple panels, similar to what is found in the Properties dialog. Actual panels/options vary depending on the type of element selected.
-
Network: Use this spider tool to see the relationship of elements and explore the various levels of your environment.
-
Alarms: View and manage alarms for the selected element. Client-side and server-side alarm filters can be created to refine the data seen here.
For instructions on configurations for alarm suppression, server-side alarm filters and other configurations that affect the display of alarms; see
Customizing Monitored Elements and Alarms
the Operations Center 5.6 Server Configuration Guide. -
Layout: View a hiearchical diagram of the element and its children or view custom drawings as created by your Administrator. Layout diagrams provide a visual analysis of critical relationships and conditions across multiple branches of an element hierarchy.
For instructions on creating custom drawings in the Layout View, see the Operations Center 5.6 Custom Drawing and Layout Guide.
-
Performance: Chart real-time performance information or historical information such as alarm history to provide an indication of how an element is performing.
For instructions on capturing alarm history and performance metrics, see
Capturing Alarm and Performance History
the Operations Center 5.6 Server Configuration Guide.
Review the following sections to understand the different views, elements, and how to navigate the console: