2.1 Console Views
The console provides a hierarchical tree of network organizations, including six different views that are accessed through tabs at the bottom of the window: , , , , , and .
The information displayed depends on the selected view, and is filtered for the element selected in the Explorer pane. The level of detail displayed depends on the permissions set by the administrator. For more information on permissions, see the Operations Center 5.6 Security Management Guide.
The following sections contain illustrations of the six different views:
2.1.1 Summary View
The view displays the first-level child elements of the element selected in the pane. Use the view to view condition and summary information about the elements in a heirarchy.
Figure 2-2 Console Summary View
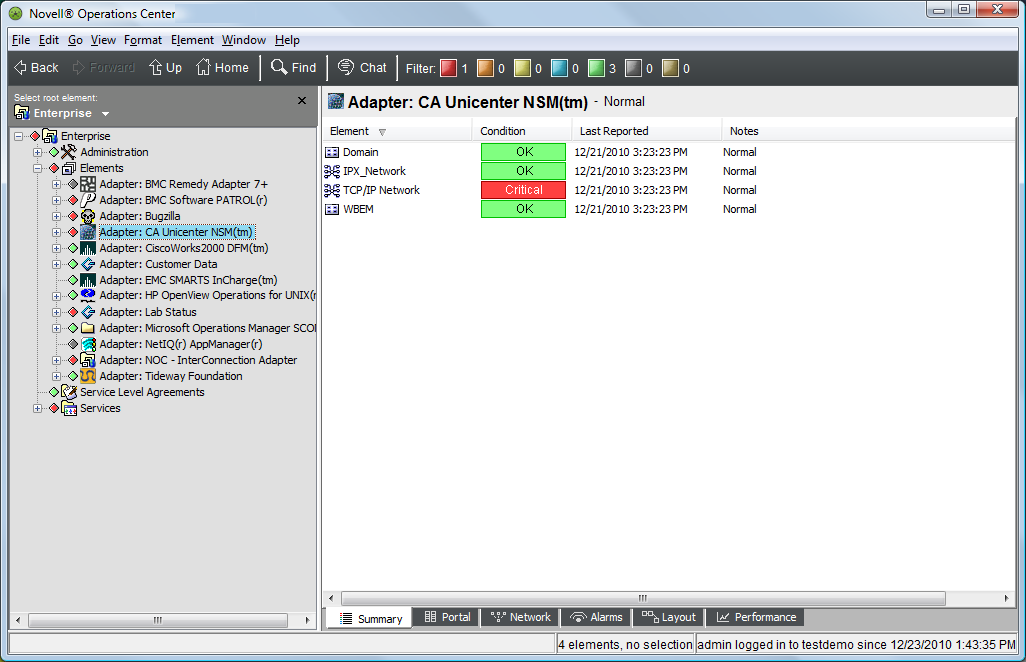
The bottom status bar displays the total number of elements in the view and the number of elements currently selected.
For instructions on using the Summary view to manage element status, see Section 4.0, Monitoring Elements and Element State.
2.1.2 Network View
The view provides a graphical view of elements and their relationship to other elements within the larger infrastructure. It presents the selected element at the center of the view, with lines connected to first-level child elements. The line colors identify the condition of the child element:
Figure 2-3 Network View
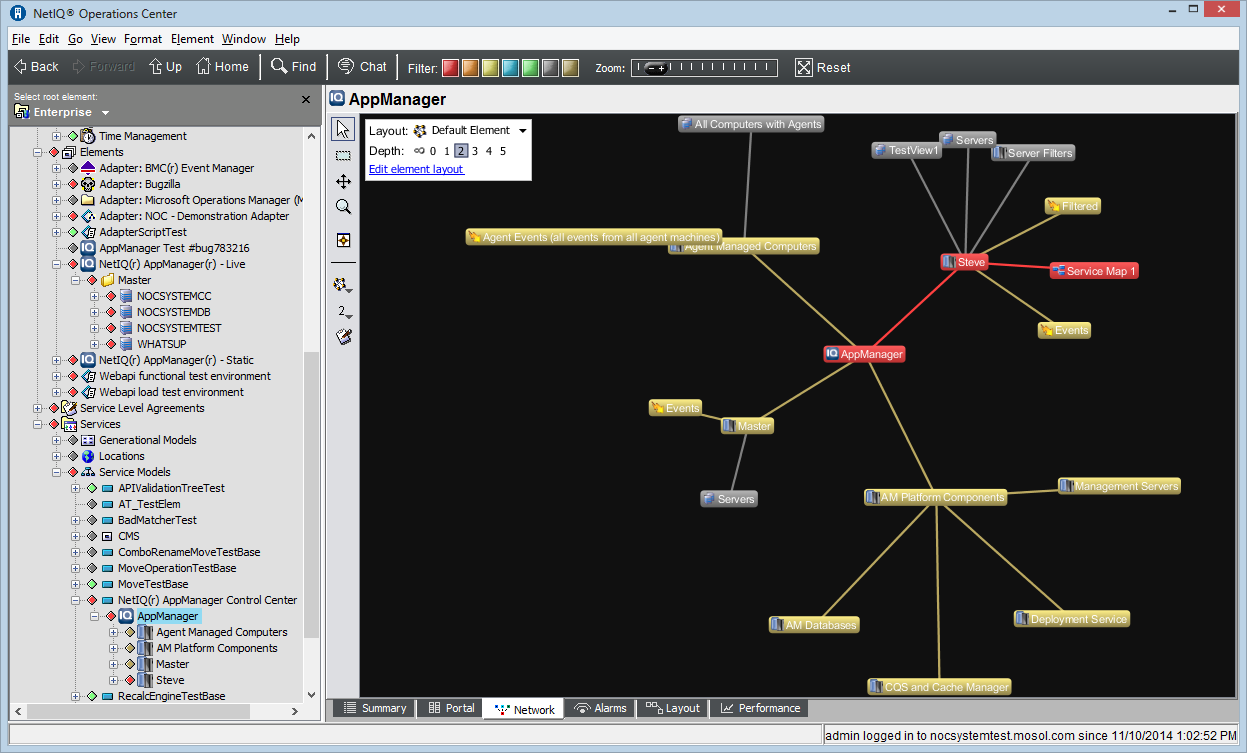
User access privileges determine which elements display in the view. The currently selected level of the element hierarchy in the pane determines whether the entire network displays, or only a portion of it.
For instructions on using the Network view to navigate and monitor elements, see Section 5.0, Exploring Element Hierarchies.
2.1.3 Alarms View
The Alarm View displays information about alarms associated with the elements, allowing you to gain insight into the state and activity of your technology components and business services.
Figure 2-4 Alarms View
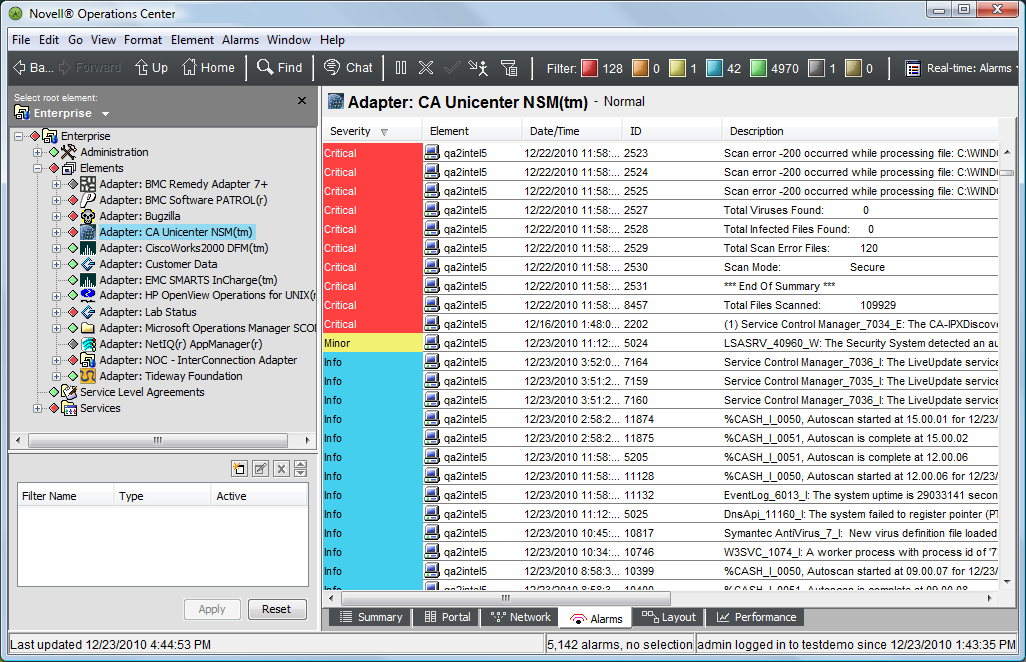
Create one or more alarm filters to manage and filter alarms.
For instructions on using the Alarms view to manage and filter alarms, see Section 7.0, Filtering and Managing Alarms.
2.1.4 Layout View
The Layout view allows you to manage and monitor services using a graphical representation that focuses on the relationships among the elements. Figure 2-5 shows the default bubble layout used by the Layout view.
Figure 2-5 Layout View

The view is available for all elements, including:
-
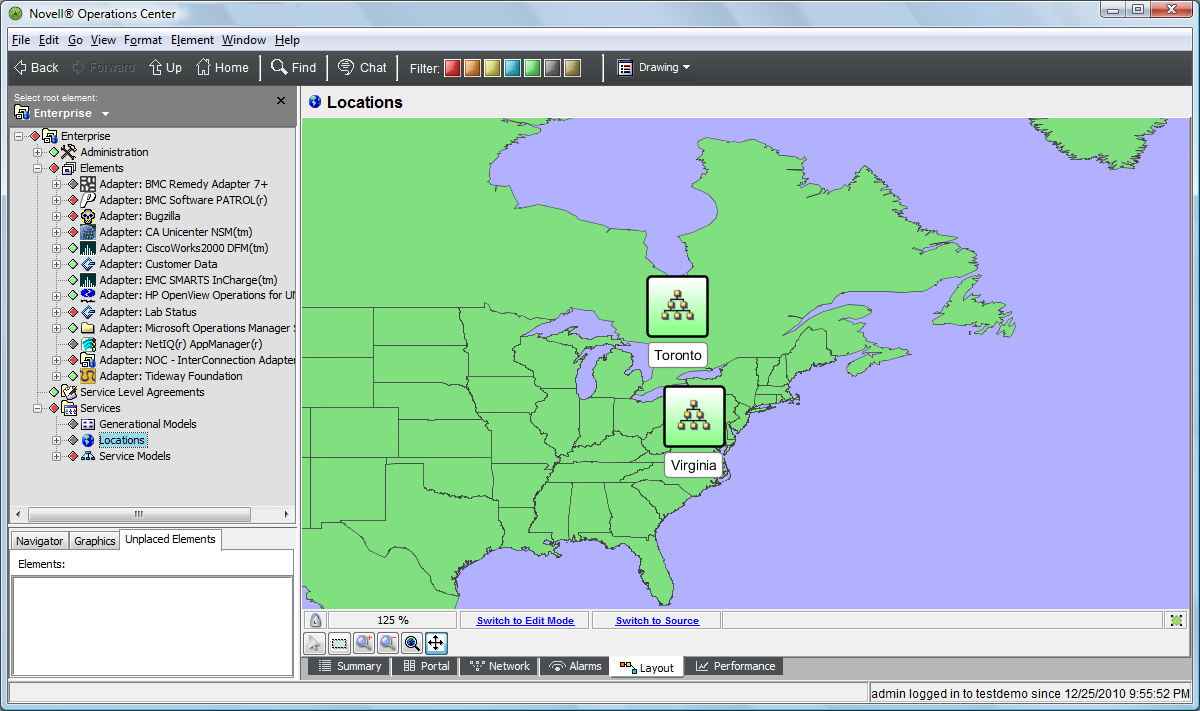
Services > Locations: Displays a global map. Each color-coded geographical site identifies the most severe condition among its child elements.
-
Services > Service Models: Displays icons representing any element and type of relationship among elements, such as functional organizations or processes. Customize the view using drawing tools.
Your Administrator can customize the Layout view by creating custom drawings. The type and level of drawing is only limited by your creativity. For example, views for elements under > show element nodes positioned on a geographical map:
Figure 2-6 Example of a Location Layout View
For instructions on creating custom drawings in the Layout View, see the Operations Center 5.6 Custom Drawing and Layout Guide.
2.1.5 Portal View
The view provides a comprehensive view and management gateway for each system element. It also contains sections for links to other views or related elements, element actions, and element notes. Because options on elements vary depending on the type of element, the number and names of Portal sections vary among adapters and elements.
The following is a typical view for an adapter under the root:
Figure 2-7 Portal View

Access to options depends on the user’s access privileges. Some administrative tasks are easiest when performed in the view. For example:
-
Defining users and groups
For information on assigning permissions to users and groups, see the Operations Center 5.6 Security Management Guide.
-
Defining automation events
For information on defining automation events, see
Defining and Managing Automation Events
in the Operations Center 5.6 Server Configuration Guide. -
Setting up calendars and schedules
For information on setting up time management objects, see
Time Categories, Calendars, and Schedules
in the Operations Center 5.6 Server Configuration Guide.
By default, the view displays with its sections collapsed. Table 2-1 shows the sections commonly found in the view.
As you work, the view “remembers” the expanded and collapsed settings for each section. Therefore, as you click from element to element, only the sections you were working in stay open. Taking the same actions on more than one element is especially convenient through the view and saves the time of opening and closing the Property pages for each element.
Table 2-1 describes some of the various options, which vary depending on the type of element selected.
Table 2-1 Standard Portal View Sections
|
Name |
Description |
|---|---|
|
|
Enables administrators to view and define access privileges for an element. For information, see |
|
|
Performs specific actions on the selected element. For example: , , , , . If you have purchased the SLM and the element has performance data, select the action to open a Performance Analysis window. |
|
AUDIT |
Enable audit events available for administrative elements. For information, see |
|
|
Enables administrators to define a list of automated events and actions for an element. For information, see |
|
|
Identifies any blackout calendars as defined for the element. For information, see |
|
|
You can enter comments about the element, and view comment histories. |
|
|
Enables administrators to specify the algorithm to use to calculate an element’s condition. The tab is available for elements created using event-based adapters only. It is not available for elements created using object-based adapters such as NetIQ, HP OpenView, the Intercommunication adapter, and Spectrum. For information, see |
|
|
Enables administrators to specify contact information for elements in the hierarchy. |
|
|
Displays the XML code used to generate the element. |
|
|
Enables administrators to specify the elements that drive the element’s alarms and condition. The tab is available for elements under . For information on Service Models, see the Operations Center 5.6 Service Modeling Guide. |
|
|
Shows all objects that are affected by the element’s state. For information, see Section 4.5, Viewing Root Cause and Impacted Elements. |
|
|
Displays comments about the element and its descendents. For example, the number and type of alarms. |
|
|
A list of all available performance profiles showing those where the element is a member. Select a profile’s check box to add or remove it from the profile. The Data Warehouse uses profiles to select the elements for which alarm history is collected. For information on creating profiles, see |
|
|
Displays a list of properties for the selected element, including the current condition level and most recent update time. Depending on the element type, other properties can be displayed, including the port number, number of timeouts, heartbeat, reconnected poll, connect mode, filter, and worst application instance. For information on adapter properties, see |
|
|
Provides links to the parent and descendents of an element using the provided links. |
|
|
Identifies the objects that affects the selected element’s state. The pane identifies the hierarchy of the elements involved. For information, see Section 4.5, Viewing Root Cause and Impacted Elements. |
|
|
Identifies any service level settings or objectives that are defined for the element. To learn more about Service Level Agreements, see the Operations Center 5.6 Service Level Agreement Guide. |
|
|
View basic status information for the element. |
|
|
Provides links to open views (, , , and ) using the provided links. |
HINT:Right-click the background of any section in the view (except the view’s gray background) to display a menu for the selected element.
2.1.6 Performance View
The Performance view charts system performance in real time, including historical performance data for elements associated with specific management systems or with the Service Level Manager (SLM), which is a product of Operations Center for managing service level agreements (SLAs).
Figure 2-8 Performance View

For information on charting performance data, see Section 8.0, Charting Performance Data.
For details on configurations for capturing historical data or default chart settings, see Capturing Alarm and Performance History
in the Operations Center 5.6 Server Configuration Guide.
For information on using the view in connection with SLM and SLAs, see the Operations Center 5.6 Service Level Agreement Guide.