8.3 Charting Performance Data
The following sections describe the steps for selecting elements and properties to create performance charts:
8.3.1 Creating Charts
In the Performance view, the Chart Properties pane lists the types of performance information that has been gathered for an element, such as the number of alarms for each severity type (Alarm Severity Counts) and tring the changes in condition for an element (Element Condition).
The following topics are related to creating charts:
Creating a Chart in the Performance View
To create a chart:
-
In the Explorer pane, select an element.
-
Click the Performance tab.
The Performance view updates. A timeline selector displays at the top of the view pane.
-
To adjust the timeline to display a specific time frame, do one of the following:
-
Table 8-3 describes the timeline icons you can use to adjust the timeline.
Table 8-3 Timeline Icons
Timeline Icons
Function
Display Setup
Displays the time frame defined by a user-defined Start and End time or the selection of a saved bookmark.
Bookmark
Displays the time frame based on a selected bookmark.
For more information, see Section 8.7, Navigating with Charting Bookmarks.
Page B
Moves the timeline bwards by an entire view.
Unit B
Moves the timeline bwards by one unit of time.
Page Forward
Moves the timeline forwards by an entire view.
Unit Forward
Moves the timeline forwards by one unit of time.
-
Click and drag the timeline to a position using the actions described in Table 8-4.
Table 8-4 Mouse Click Actions
Mouse Click Action
Function
Click and drag left
Navigates forward in time.
Click and drag right
Navigates b in time.
Shift+click or Shift+click
Seeks the next occurrence of information forward or bward in time.
Ctrl+click and drag left
Zooms out on chart data.
Ctrl+click and drag right
Zooms in to chart data.
Double-click
Opens the Display Setup dialog box.
Duplicate property names can exist. Two or more properties attached to an element can gather properties with the same name. If duplicate properties display in the Chart Properties pane, the associated profile name displays in parentheses.
-
-
To automatically display properties in the Chart Properties pane for the element selected in the Explorer pane, do any of the following:
-
Select one or more properties in the Chart Properties pane.
-
To select multiple properties, press the Ctrl key, then click the properties.
-
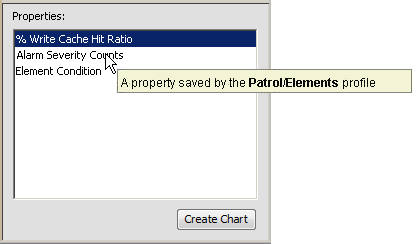
To view chart profile information in a tooltip format, position the mouse over a property name.
The tooltip lists the profile associated with the property:

Consider the following concerning the properties:
-
Properties originate from either an external management system, such as PATROL, or from profiles created by the administrator.
-
If many properties are available, expand the Chart Properties pane by dragging up its top border.
-
If performance data is unavailable for the selected element, the Chart Properties pane is empty, meaning a chart cannot be created.
-
-
Click Create Chart.
The charts display as a chart group in the Performance view.
Depending on the number of selected chart properties, more than one chart might display. All charts created at the same time are considered in the same chart group. To understand the relevance of chart groups, see Section 8.3.3, Updating a Chart Group.
When charting SLA metrics (Availability and Outage Count), it can take up to several minutes before a chart registers an update, while updates for other property types are charted in near-real-time. In this case, the server has not yet recorded update data for these properties.
-
To create additional charts, repeat Step 1 through Step 5.
Clicking the Create Chart button creates a new chart beneath the most recent chart in the Performance view. It is considered a separate chart group.
Adding a Single Chart Quickly
To add a chart quickly:
-
Double-click a property in the Chart Properties pane.
The new chart displays in the Performance view. It displays with existing charts, but is a separate chart group.
Creating an Area Line Chart
The standard Line chart tracks values using a line on the Y‑axis. The Area Line chart fills in the range between zero and the line value.
To create an Area Line chart:
-
Create a standard Line chart.
For instructions, see the steps listed earlier in this section.
-
In the Performance view, right-click the chart, then select Filled.
When selected, the Area Line chart displays. When deselected, the standard Line chart displays.
Creating a Pie Chart of Condition Values
To show average condition values in a pie chart:
-
Create a Condition Line chart. For instructions, see the steps listed earlier in this section.
-
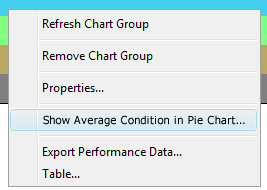
In the Performance view, right-click the Condition Line chart, then select Show Average in Pie Chart:

A Pie chart opens in a separate dialog box.
8.3.2 Refining the Displayed Chart
Selecting too many data points can create an illegible chart. Also, all data points might not display in the chart. Magnify one area of the chart for a better view of data points. Other chart refinements include hiding profile names in the Chart Properties pane, to make it easier to see when numerous properties exist.
Magnifying an Area of a Chart
To zoom and magnify a chart:
-
Use the Zoom feature to magnify the display and refresh the data.
For more information, see Navigating Performance Charts and Navigating with Bookmarks.
Displaying or Hiding Profile Names in the Chart Properties Pane
To hide or show profile names in chart properties:
-
Right-click the background of the Chart Properties pane, then select Show Profile.
When selected, the profile names display.
8.3.3 Updating a Chart Group
Charts display in chart groups in the Performance view. Clicking the Create Chart button creates a new chart group. A chart group can contain one or more charts, depending on the number of chart properties selected.
After creating a chart group, update charts in the group by making additional property selections or selecting a different element to chart.
HINT:Position the cursor over a data point to view a tooltip with relevant data for that point in time. For Condition charts, position the cursor over the actual data point (not the connector line).
To update a chart group:
-
In the Performance view, select the chart group.
The element and properties used to create the charts appear highlighted in the Explorer pane and Chart Properties pane, respectively.
-
To chart a different set of properties for an element, select or deselect properties in the Chart Properties pane.
-
To create a chart for a different element:
-
Select a different element in the Explorer pane.
-
Then select properties in the Chart Properties pane.
-
-
Click Apply Changes to update the current chart group with the changes.
For example, select three properties and create three charts, deselect a property, then click Apply Changes. The chart group redisplays using the last two selected properties, displaying only two charts.
8.3.4 Refreshing Performance Data
Data used to create a chart originates from the time the Performance view initially displayed. As time passes, it is necessary to refresh the chart with the most recent data from the native management system associated with the charted elements.
To refresh chart data:
-
Do one of the following in the Performance view:
-
Click a chart and then click Refresh on the toolbar.
-
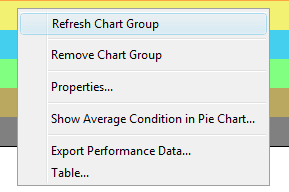
Right-click a chart, then select Refresh Chart Group to refresh all charts in the group.

-
8.3.5 Removing Charts
To remove a single chart or the entire chart group:
-
Do one of the following:
-
Right-click a chart, then select Remove Chart.
The chart disappears from the Performance view.
-
Right-click a chart, then select Remove Chart Group.
All charts in the current chart group disappear from the Performance view.
-