7.5 Configuring the Service Warehouse
The Service Warehouse stores alarm history and comments as well as historical performance and service level data. For supported databases and specific product requirements, see the Operations Center 5.6 Getting Started Guide.
The Service Warehouse gathers the service level metrics required for determining whether service compliance is being met and service level health is acceptable, both of which are critical to managing service level agreements (SLAs). Management of SLAs requires the use of another Operations Center product called the Service Level Manager (SLM), which is licensed separately. For more information about SLAs and SLM, see the Operations Center 5.6 Service Level Agreement Guide.
Even if you are not using SLAs and SLM, you need to create and define a Service Warehouse in order to use alarm history data. For more information on alarms, see Section 11.0, Customizing Monitored Elements and Alarms.
The following sections cover various topics related to creating and maintaining a Service Warehouse:
7.5.2 Configuring the Service Warehouse
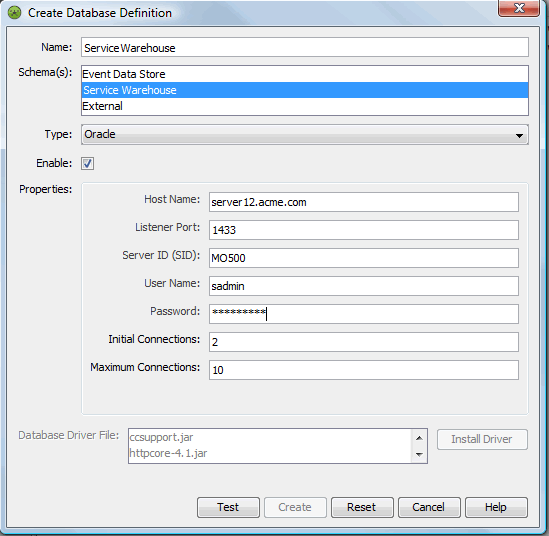
To define and configure the Service Warehouse, you’ll need to create a database definition specifically for the Service Warehouse. Once this definition is created, any change to the Database Type requires a restart to the Operations Center server.
To configure and enable the Service Warehouse:
-
In the Operations Center console pane, expand > .
-
Right-click , then select to open the Create Database Definition dialog.
-
Enter a name for the definition in the field.
It is best practice to use a name without spaces or special characters.
-
In the Schema(s) section, make sure that is selected.
-
Click the drop-down list, then select a database type.
If selecting , there are required configurations for Windows servers. For more information, see Section 7.1, Configuring Windows Servers for Single Sign On (SSO).
NOTE:Once the Service Warehouse definition is created, any change to the Database Type requires a restart to the Operations Center server.
-
Select the check box to activate the database definition.
-
Specify the Database Properties required to establish the database connection (the required properties vary depending on the database):
Database Properties
Description
Hostname
The name of the database server.
Listener Port
The port on which the database listens for communications.
Server ID (SID)
The name of the database (used when defining an Oracle database connection).
Database
The name of the database (used when defining a Microsoft SQL Server, Sybase, or DB2 database connection).
Domain
The domain to use for domain authentication with single sign on (used when defining a Microsoft SQL Server database with Domain Authentication).
User Name
The name of the user account. When multiple Operations Center schemas exist within the same database, a unique ID must be created for each database schema.
If using Microsoft SQL Server with Domain Authentication, specify the username of the Windows user account, or leave blank (on Windows servers) to attempt to use the credentials of the currently active Windows user account.
Password
The password for the user account.
If using Microsoft SQL Server with Domain Authentication, specify the password of the Windows user account, or leave blank (on Windows servers) to attempt to use the credentials of the currently active Windows user account.
Initial Connections
The number of connections established upon initial connection.
Maximum Connections
The maximum number of connections allowed.
Additional Properties
(Optional) Additional JDBC URL properties for Microsoft SQL Server and Microsoft SQL Server (Domain Authentication) databases. Prefix each parameter entry with a semi-colon. For example,
;parameter1=value1;parameter2=value2
Database Class, URL, and Driver File
Name and location of the IBM DB2 driver. If using an IBM DB2 database, it is necessary to upload the JDBC driver file supplied by IBM.
When setting the number of database connections allowed, calculate the number of required database connections by analyzing your user base and other Operations Center settings. Identify the following:
-
The number of database connections required in part depends on how many users access reports.
-
The number of database connections used for storing alarm history has a one-to-one correspondence to the number of alarm threads configured for the Service Warehouse.
-
The number of database connections used for storing Performance Series data has a one-to-one correspondence to the number of performance threads configured for the Service Warehouse.
Then, use the following calculation to estimate the number connections needed:
(# users * 0.5) + (# of Alarm Threads * 1) + (# Series Threads * 1) +10
The Service Warehouse uses a connection pool, therefore each connection is returned to the connection pool when the query is complete. If the number of used connections is always at the maximum, then increase the number of connections by 20 percent.
-
-
Click the button to browse, then select a driver file.
-
Click the button to test and verify that the database settings are valid, prior to creating the definition.
If the database connection is valid, the button activates.
IMPORTANT:If you are using Operations Center in a clustered environment, one Operations Center server must be designated as the primary server writing to the Service Warehouse. This is indicated in Configuration Manager on the pane on the tab. On one configuration, change the option to True. By default all others are False.
For information on clustered environments, see Implementing a High Availability Solution
in the Operations Center 5.6 Server Installation Guide.
7.5.3 Customizing Data Collection Settings for Alarms and Performance Metrics
The Service Warehouse is preconfigured with default settings that allow Operations Center software to capture and record alarm and performance data. These settings can be adjusted depending on the various needs of your system.
System performance can vary based on the combined settings specified for Performance Threads, Transactions Per Commit, and Purge Block Size. A higher transaction limit provides better performance. However, it can increase database recovery time, and the potential of locking out other threads trying to access the same tables. If set too high, the database can also run out of database cursors.
Table 7-3 shows the setting values that are likely to produce the best performance levels for most systems.
Table 7-3 Recommended Settings for Most Systems
|
Setting |
Sybase |
Oracle |
MSSQL |
|---|---|---|---|
|
Performance Threads |
4 |
4 |
4 |
|
Transactions Per Commit |
50 |
50 |
50 |
|
Purge Block Size |
1,000 |
2,000 |
1,000 |
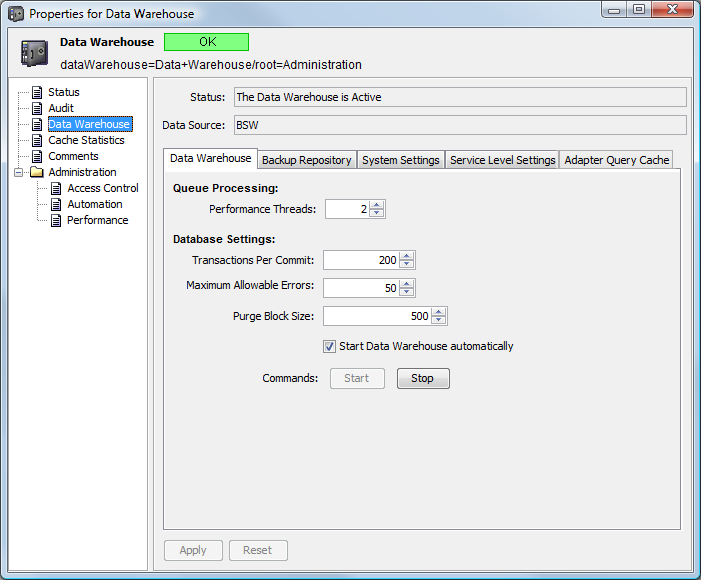
The Service Warehouse collects alarm and performance data using an element called which appears in the hierarchy in the Operations Center console under > . For information about collecting data for service level agreements, see the Operations Center 5.6 Service Level Agreement Guide.
To edit or configure Data Collection settings:
-
In the pane, expand the root element.
-
Right-click , and select .
-
Select in the left pane.
-
( tab) Configure the following options for the capturing, recording, and maintenance of alarm and performance data:
-
Performance Threads: The number of threads to handle historical performance data.
The queue for Performance data can have a maximum of eight threads with each thread using one or two database connections.
-
Transactions Per Commit: The number of objects per commitment.
A higher transaction limit provides better performance. However, it can increase database recovery time, and there is the potential of locking out other threads trying to access the same tables. If set too high, the database can also run out of database cursors. It is suggested to use a setting of 50.
-
Maximum Allowable Errors: The maximum allowable errors before the Service Warehouse shuts down.
NOTE:When the threshold is exceeded (i.e. when the database runs out of disk space or the database is unavailable for any reason), the Service Warehouse automatically initiates the Backup Repository, if enabled. If the Backup Repository is not enabled, data processing is shutdown entirely.
When the database becomes available again, it is necessary to disable and then reenable the Database Definition (created in Section 7.5.2, Configuring the Service Warehouse) which alerts the Service Warehouse to switch from backup mode and return to using the database.
-
Purge Block Size: The number of objects to clear from the database with each purge transaction.
-
Select the check box to start the Data Warehouse when the Operations Center server is started.
-
-
( tab) Configure cache settings for responses from integration systems. The data returned from adapter queries can be cached to help speed response times.
-
Adapter Query Cache Size: The number of adapter responses to cache.
-
Adapter Query Cache TTL: The retention time (in seconds) to hold query responses in the cache.
-
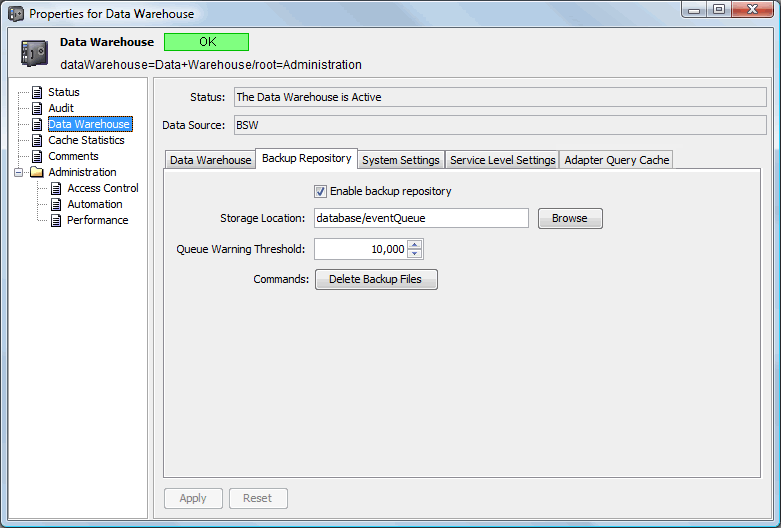
7.5.4 Enabling the Service Warehouse Backup Repository
The Service Warehouse has a backup repository system which uses a file system that stores excess data until queues return to normal and data in the backup files is processed.
When enabled, Operations Center uses the in-memory queue and writes data to a backup repository in the event that:
-
The Service Warehouse database connection fails.
-
The database temporarily shuts down.
-
The in‑memory queue for writing historical data to the database exceeds the setting, when is set to MEMORY-QUEUED in the Configuration Manager. For more information on the database setting, see Step 5.
For more information on Configuration Manger settings, see Section 2.2.11, Database Pane.
-
The setting is reached and exceeded (for example, when the database runs out of disk space or the database is unavailable for any reason) and the Service Warehouse shuts down. For more information on the database setting, see Step 4.
In this case, it is necessary to re-enable the database definition after the problem is solved and the database is available. For more information see Section 7.3.5, Disabling and Deleting a Definition.
To enable or configure settings for the backup repository:
-
In the pane, right-click the root element, then select to open the Status property page.
-
In the left pane, click to open the Data Warehouse property page, then select the tab:
-
Select the check box to activate the back repository process.
If implementing Service Level Management (SLM), enabling the backup repository is required. For more information about SLM, see the Operations Center 5.6 Service Level Agreement Guide.
-
(Optional) To specify the location of the backup repository, enter the directory for the backup repository files in the field, or click to navigate, then select a directory.
The backup repository is configured and enabled by default to store data in the /OperationsCenter_install_path/database/eventQueue directory.
-
(Optional) Specify the following settings when is set to MEMORY-QUEUED in the Configuration Manager:
Maximum Disk Space: The maximum amount of disk space used for backup repository files.
Maximum File Size: The maximum size of a generated backup file before an additional backup file is created.
Queue Maximum: The maximum size for the database queue, above which additional collected data is written to backup repository files.
Queue Minimum: The minimum size for the database queue, below which any data stored in backup repository files is reissued to the queue.
-
(Optional) To process existing backup repository files when the Service Warehouse starts, select the check box.
-
(Optional) To delete all existing backup repository files, click the button.
-
Click to save the changes.
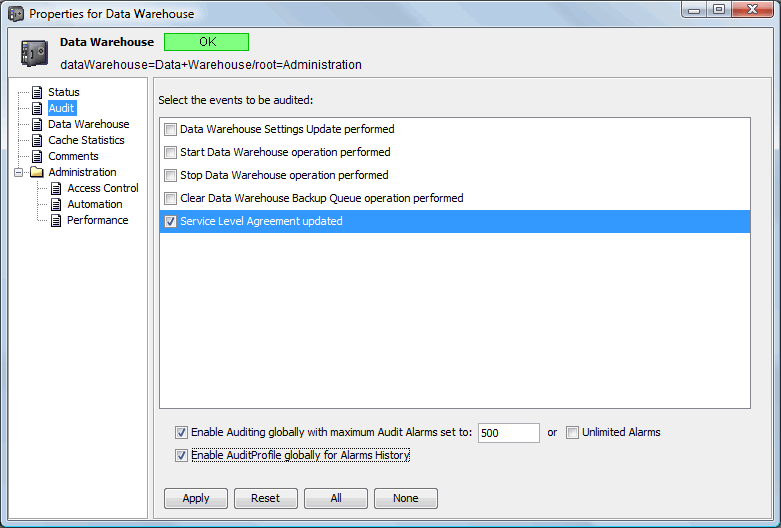
7.5.6 Auditing Service Warehouse Events
Updates to the Service Warehouse can be audited. The following events can be audited:
-
Service Warehouse settings updated
-
Start or stop the data warehouse engine
-
Clear the Service Warehouse backup queue
Audit events display in the channel in the view on the element. For information about audited events, see the Operations Center 5.6 Security Management Guide.
Auditing is set in the pane, under . Right-click , then select . On the tab, select the events to audit. Audit events display in the view. For more information on alarms, see Section 11.0, Customizing Monitored Elements and Alarms.
To set auditing:
-
In the pane, expand .
-
Right-click , then select to open the Status property page.
-
In the left pane, click to update the property page:
-
Select the events to audit.
-
Click the button.