10.1 Predefined Templates
Predefined templates show the following types of data:
-
Alarm counts in pie or bar charts
-
SLA status in a dashboard
-
Status and location of an element on a map chart
-
Numeric element properties in a speedometer gauge
These templates can be added to a Web page by using the Chart Builder portlet.
All Chart Builder templates automatically contain a link added to the bottom right corner of the portlet that allows the user to view the source data used to generate the chart. For more information about viewing source data, see Section 7.7, Viewing Source Data for Charts
The following sections show examples of the predefined templates included with the Dashboard and provide steps for deploying charts and configuring the SLA Status Dashboard:
10.1.1 Chart Display Examples
The following sections show examples of the different types of displays:
Alarms Charts
By default, there are four types of charts that show alarm data.
-
Element Alarms Pie Chart, as shown in Figure 10-1
-
Child Element Alarms Bar Chart, as shown in Figure 10-2
-
Element Alarms Bar Chart, as shown in Figure 10-3
-
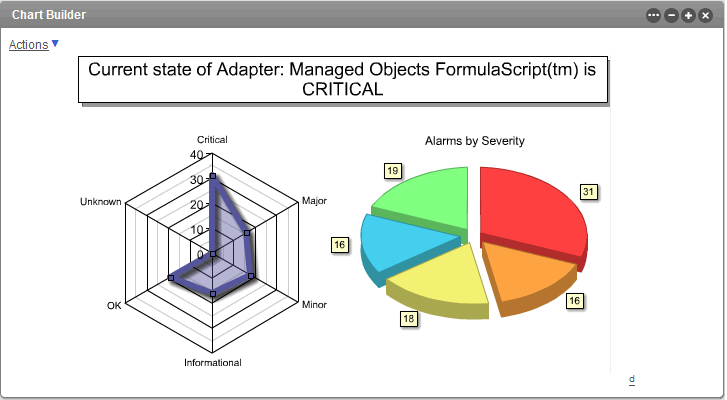
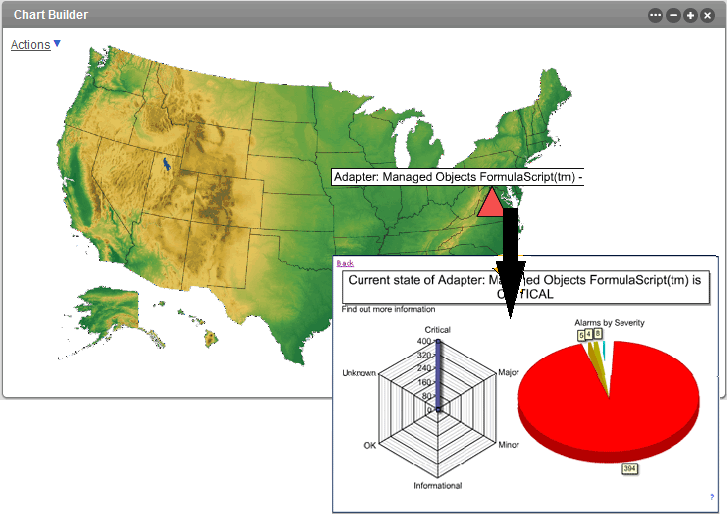
Element Alarms Radar and Pie Chart, as shown in Figure 10-4
The user can click the link located in the bottom right corner of the portlet to view data used to generate the chart.
Figure 10-1 Element Alarms Pie Chart in the Chart Builder Portlet
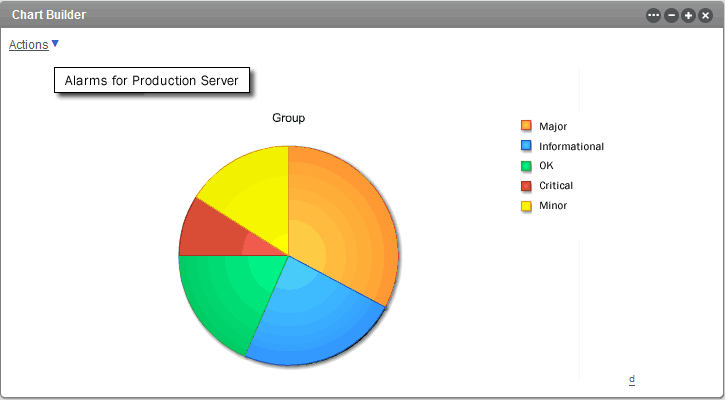
Figure 10-2 Child Element Alarms Bar Chart in the Chart Builder Portlet
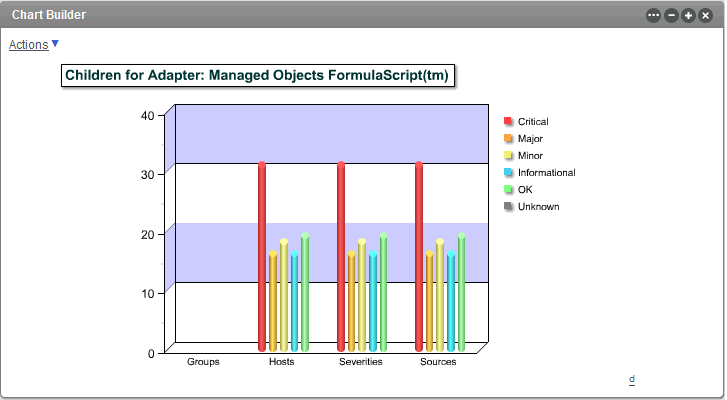
Figure 10-3 Element Alarms Bar Chart in ChartBuilder Portlet
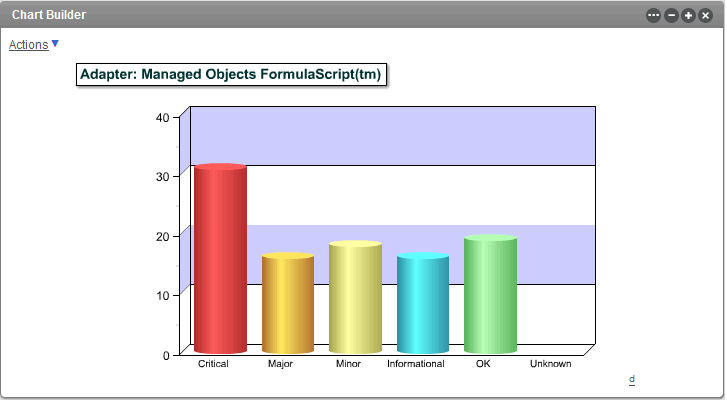
Figure 10-4 Element Alarms Radar and Pie Chart in Chart Builder Portlet
Map Chart
The Map Chart template shows a map from the hierarchy tree in Operations Center with drill-down to show alarm charts. The user can click the link located in the bottom right corner of the portlet to view data used to generate the chart.
Figure 10-5 Maps with Drill-down URL in the Chart Builder Portlet
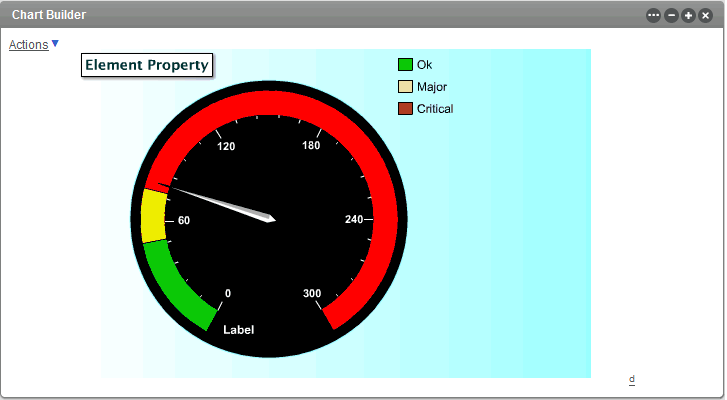
Element Properties Gauge
The Element Properties Gauge template shows element property information in a gauge speedometer. The user can click the link located in the bottom right corner of the portlet to view data used to generate the chart.
Figure 10-6 Element Property Gauge in Chart Builder Portlet
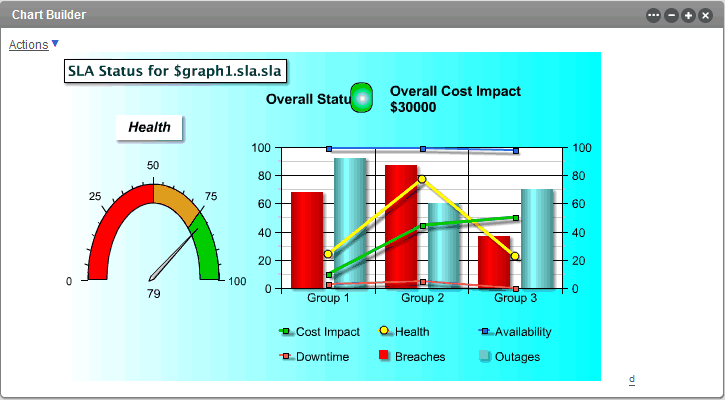
SLA Status Dashboard
The SLA Status Dashboard template shows service level agreement status information including breach and outage counts overlayed with health, downtime, availability and cost impact levels. The user can click the link located in the bottom right corner of the portlet to view data used to generate the chart.
Figure 10-7 SLA Status Dashboard in the Chart Builder Portlet
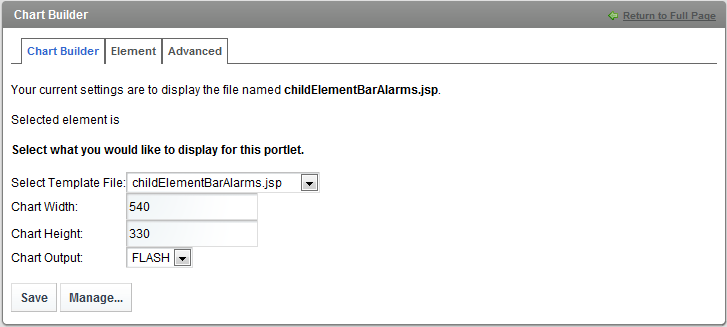
10.1.2 Deploying Charts
Charts are deployed and configured by using the Chart Builder portlet in the Dashboard.
If some of the chart elements overlap after you configure the chart, increase the chart width.
To configure the Chart Builder Portlet:
-
Add the Chart Builder portlet to a web page.
For more information on adding a portlet to a page, see Section 6.2.1, Adding a Portlet.
-
Click the Configuration icon and select
-
Select a .jsp template from the drop-down list to specify the chart type.
The PCXML files are samples, or templates, that administrators use to create a new chart. They are not fully coded to show custom static data or dynamic information from Operations Center.
Click to upload a new chart template from your file system.
-
Specify the chart width in the field.
-
Specify the chart height in the field.
-
Click the drop-down list, then select the output type.
-
Specify other chart options as required, such as the chart title.
For specific information about running the SLA Status Dashboard template example, see Section 10.1.3, Setting Up the SLA Status Dashboard.
-
Click to save the chart settings.
-
Click to open the tab and select an element to drive the portlet.
-
Click to save the element selection.