9.3 Configuring the SLA Status Portlet
The portlet displays a status summary on agreement health, availability, or downtime for the selected element’s children during the specified time frames. This report uses the same data as an portlet and includes access to SLA Compliance reports by clicking any of the metrics.
Figure 9-2 The SLA Status Portlet

The portlet can also display child availability and child downtime. Detailed information in this report shows outages, downtime, availability, committed time, downtime contributed (as a percent), and outages contributed (as a percent) for leaf children.
Note the following tips and information when setting up the report:
-
When configuring the report, decide whether the user of the report can see only that element (selected element option) or that element and its children (viewable elements option). The elements that the user can view are governed by privileges set in Operations Center.
-
When reporting on child availability and downtime, you must select a calendar to use to calculate values. You must also select to define outages as either element outages, outages based on a minimum duration and threshold that you set, or apply an SLA agreement and objective.
-
In contrast to the portlet, instead of selecting a use interval or data range, you select the time periods for which data displays and whether an arrow or status box displays.
-
Setup a schedule to run the report at specified intervals. Users view a cached version for improved performance.
For more information about scheduling, see Section 7.8.5, Scheduling Portlets.
The following sections cover how to configure the settings, using the portlet and user navigation options:
9.3.1 Setting Up the SLA Status Portlet
To configure the SLA Status Portlet:
-
Click
 and select
  .
.
-
Click the tab to select the element(s) for the report to generate data on.
The default element selection is . For more information on selecting the element, see Section 7.3.2, Configuring Starting Elements for Portlets.
-
Click the SLA Status tab to specify report parameters and options.
-
Select whether the report is to be run for selected elements only, selected specific elements including children, or the children of the selected elements from the drop-down list.
-
For each selected element, do the following:
-
Select whether the report is to be run for a specific agreement, or on availability or downtime in the drop-down list.
-
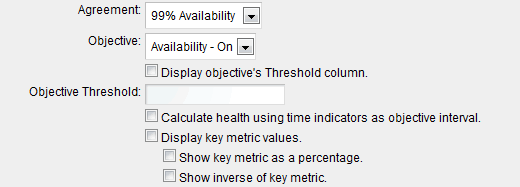
If reporting on an agreement, do the following:
-
Select or select a specific objective from the drop-down list.
-
Select the check box to a threshold reference value in the report.
Define the desired threshold value that must be reached for the selected objective, in the text box. This value is displayed in the Threshold column as a reference only.
-
If a specific objective is selected, define reporting and calculation rules with the following options:
-
Select the check box to have the specified time indicators used as the interval over which the objective is evaluated to determine compliance.
-
Select the check box to use any of the following sub-options:
-
Select check box to display the key metric as a percentage value.
-
Select check box to display the inverse value of the key metric.
-
-
-
-
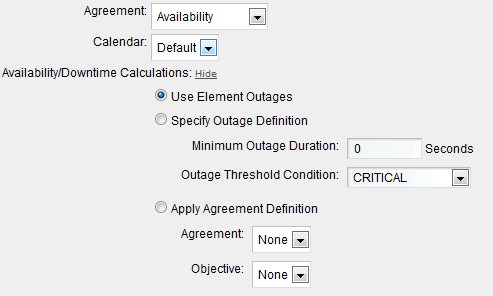
If reporting on availability or downtime (including child availability/downtime), do the following:
-
Click the drop-down list, then select a calendar.
-
Specify availability/downtime calculation rules by selecting one of the following radio button options:
-
Use Element Outages to calculate outages in the report.
-
Specify Outage Definition which requires specifying a minimum outage duration and threshold condition.
Specify the minimum duration (in seconds) for outages to include in this report in the field.
Specify the lowest severity level to include in this report in the list.
-
Apply Agreement Definition which requires selecting an agreement and an objective. This option is unavailable for Child Availability and Child Downtime.
Select an agreement from the list. If the selected element has no associated agreements, then no agreement names display. Remote agreements are listed with the prefix “Remote.”
Select an objective from the list, or select to display all objectives. If the selected agreement has no associated objectives, no objective names display.
-
-
(Child Availability and Child Downtime only) Specify the levels of children used in the availability and downtime calculation:
-
Children in hierarchical structure: Select how many levels of children that naturally exist in the hierarchy, regardless of whether they contribute to the state of the parent element, that contribute to the calculation.
-
Children contributing to state: Select how many levels of children that contribute to state but are not natural children of the element (have been matched or linked under the element), that contribute to the calculation.
-
-
-
-
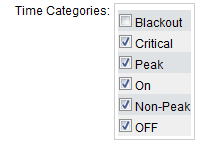
Under , indicate the time categories for the report to run against by selecting the associated check boxes.
-
Configure the report title by doing the following:
-
Specify the report title in the field.
-
Select the check box to use the default title for all displays.
-
Select the check box to not show a title in the report.
-
-
Click the drop-down list, then select the time zone for the report to use in presenting data.
-
Configure the indicator values to show for each element using the options under :
-
Include , , , , , , , , , , and values by leaving the check boxes unselected.
-
Select , or from the drop-down lists to specify the type of indicator show with each value.
-
Select the check box to display availability that is slightly less than 100% as <100% (with a down arrow).
-
-
Select the option to include options to export the report information.
-
Click the drop-down list, then select the tab for the report to use as the default report page when displaying a SLA Compliance report.
-
Select the check box to open the related SLA Compliance report in a pop-up window. If this option is unselected, SLA Compliance reports open in the same page.
-
Select the following check boxes to enable various report features shown in the SLA Compliance views:
Show Header Information: Displays the summary header information in the box at the top of each tab.
The header information includes calendar and time category selections, overall health or downtime or availability metrics, and the overall data available and data relevance indicators.
Show Root Cause: Includes the tab in the report. Only applies to health and compliance for Agreements.
Show Breaches: Includes the tab in the report. Only applies to health and compliance for Agreements. Also, select from the following options:
-
Show Objective Breaches: Displays objective breaches in the tab.
-
Show Major Breaches: Displays major condition breaches, which are breach warning alarms, in the tab.
-
Show Cleared Breaches: Displays cleared breaches in the tab. Excluding cleared breach alarms eliminates all warning and violation breaches associated with a cleared breach alarm. Only applies to health and compliance reports.
-
Show Breach List: Displays a detailed list of all breaches in the tab. By default, shows breach violations (CRITICAL) only. Includes cleared and warning (MAJOR) breaches based on and selections. Only applies to health and compliance reports.
Show Details: Includes the tab in the report. Only applies to health and compliance for Agreements.
Show Charts: Includes the tab in the report.
Show Outages: Displays the tab. Also, select from the following options:
-
Show Outages Not Generated by Element Condition Changes: Includes manually entered or imported outages, as well as system generated outages (for example, based on real-time state data) when reporting on downtime, availability, and agreement or objective health.
-
Show Outages List: Displays a detailed list of outages in the tab. Outages include only those outages that start in the report interval.
Show Options: Displays options for the user viewing the report to change the time intervals and time categories in the report.
-
Show Calendar: Displays a calendar under that allows users to select to run the report using a different calendar than the one selected in Edit mode. must be selected for this option to have any effect.
-
-
Click .
If you exit without clicking first, your changes are lost.
-
If this report is to be run automatically on scheduled intervals, click , then click to configure the report to run at regular intervals.
For more information about , see Section 7.8.5, Scheduling Portlets.
9.3.2 Using the SLA Status Portlet
While viewing the portlet, do any of the following:
-
Click to update the data in the view. Only real-time data is refreshed in the view. Scheduled reports update the next time the schedule job runs.
-
To navigate between views, do the following:
-
Click an element name to drill-in to an SLA Status report for child elements.
-
Click the link to return to the parent SLA Status report.
-
Click
 to return to the default home view of the report as defined in .
-
Click
 to save the report as a PDF file.
-
-
Click any metrics value to view the report.
For more information on the report, see Section 9.2, Configuring the SLA Compliance Portlet.
9.3.3 Setting Up User Navigation to Drive an SLA Status Portlet
If you use the SLA Status portlet on a page, you can also add and configure a Starter portlet, Navigation portlet, Search portlet, or Status portlet to dynamically control element selection for a SLA Status portlet implemented within the same portal page.
For SLA portlets, you’ll configure a default element(s) but in addition, you can set up a Starter portlet, Navigation portlet, Search portlet, or Status portlet on the same page can also allow users the ability dynamically change the element selection that drives data in the SLA portlet.
These portlets can be used to create a single page to report on multiple services for a single user, or to create a single page for multiple role-based users, or to produce a single page that supports multiple end users who have different data access privileges. It eliminates the need to create multiple customers without having to create separate portal pages for everyone.
For more information, see Section 7.4, Using Navigation Mode to Drive Multiple Portlets or the section on each portlet type: