9.2 Configuring the SLA Compliance Portlet
The SLA Compliance portlet displays compliance/agreement health or availability/downtime data, outage counts, breaches counts, root cause, and a detailed listing of all outages and breaches for specified intervals of time.
Health/compliance, availability, or downtime for agreements and objectives (OLA) are shown in a calendar view. This report can include charts of the agreement health or downtime or availability, lists of outages, and lists of breaches. Data can be shown at various levels of detail (for example, year, month, week, day, hour, minute). The feature can chart the objective value being measured as a percentage or inverted value.
The report portlet can reveal up to six reports, or tabs, of information for the user:, , , , , and . These tabs can be hidden from display with report settings found in .
Figure 9-1 SLA Compliance Portlet showing the Compliance tab
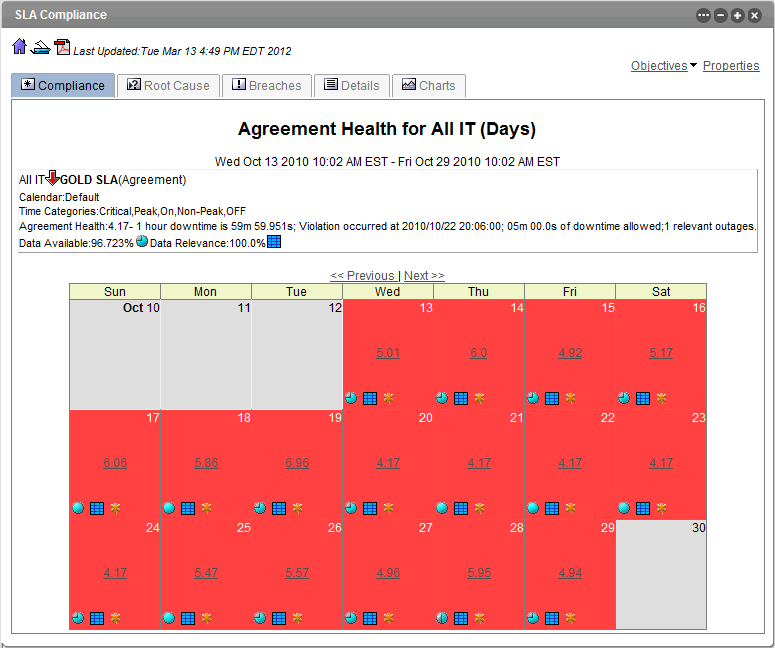
For samples of other tabs in this report, see the Novell Operations Center 5.0 Service Level Agreement Guide
Table 9-1describes the icons and indicators that are used by the SLA Compliance to show levels of data availability, compliance, and relevance.
Table 9-1 Degrees of Data Availability and Relevance
|
Icons |
Type |
Description |
|---|---|---|
|
|
Data Available |
Indicates the amount of data available for the measured period of time. Icons indicate specific value targets or ranges of values, such as 0%, 0.1%–33%, 33.1%–65.9%, 66%–99.9%, 100%. |
|
|
Compliance Grades |
Indicates a level of compliance from A–F based on compliance percentage. Icons indicate the range where, by default, green is 80–100%, blue is 70–89%, yellow is 60–69%, orange is 50–59%, and red is any compliance less than 50%. |
|
|
Data Relevance |
Indicates the relevancy of data to the reported period of time. For instance, there can be data available, but it is not considered (relevant) if the associated Time Category is filtered out (for example, a blackout). Icons indicate specific value targets or ranges of values, such as 0%, 0.1%–33%, 33.1%–65.9%, 66%– 99.9%, 100%. |


For more information about the data displayed in this report, particularly information about outage duration, see the Novell Operations Center 5.0 Service Level Agreement Guide
Note the following tips and information when setting up the report:
-
There are three main types of reports: compliance/health, availability, and downtime. Each one has slightly different options to select in . When creating any of these reports, select a calendar from Operations Center to filter the display based on time category selection.
-
To create a report on health and compliance, select the objective definition option for the calculation rules, then select an agreement and objective. For this type of report, the calendar for the agreement is always used. By default, the time defined in the objective is used to calculate compliance.
-
For downtime reports, time category filtering does not affect the summary metrics.
-
To allow users to change the calendar and other various report parameters on-the-fly, enable . The calendar appears as one of the options when the user clicks . In , you must select both the option and the option for the user to see both the link in the portlet view and the calendar within those options.
-
When specifying a time span for any type of report, make sure to specify one that is reasonable for reporting. Users typically want to look at a year’s worth of data in months or weeks, rather than hours or minutes, with the ability to drill down into hours or minutes.
-
The SLA Compliance portlet returns a maximum number of outages and breaches based on a property set on the Operations Center server. For instructions on configuring this property, see Section 7.8.1, Configuring Default Alarms Limits Returned from the Operations Center Server.
-
Setup a schedule to run the report at specified intervals. Users view a cached version for improved performance. Cached versions are saved for the main tabbed reports. If drilling into data, views at that level are real-time and not cached.
For more information about scheduling, see Section 7.8.5, Scheduling Portlets.
The following sections cover how to configure the SLA Compliance portlet settings, using the portlet at run-time and ad-hoc options:
9.2.1 Setting Up the SLA Compliance Portlet
To configure the SLA Compliance Portlet:
-
Click
 and select
  .
.
-
Click the tab to select the element for the report to generate data on.
The default element selection is . For more information on selecting the element, see Section 7.3.2, Configuring Starting Elements for Portlets.
-
Click the SLA Compliance tab to specify report parameters and options.
-
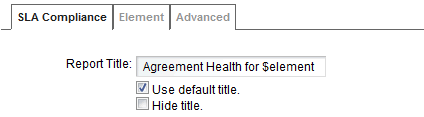
Configure the report title by doing the following:
-
Specify the report title in the field.
-
Select the check box to use the default title for all displays.
-
Select the check box to not show a title in the report.
-
-
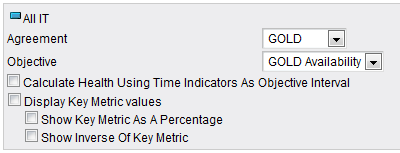
Under , select whether the report is to be run for a specific agreement, or on availability, or downtime in the drop-down list.
-
If reporting on an agreement, select or select a specific objective from the drop-down list.
If a specific objective is selected, do any of the following:
-
Select the check box to have the specified time indicators used as the interval over which the objective is evaluated to determine compliance.
-
Select the check box to use any of the following sub-options:
-
Select check box to display the key metric as a percentage value.
-
Select check box to display the inverse value of the key metric.
-
-
-
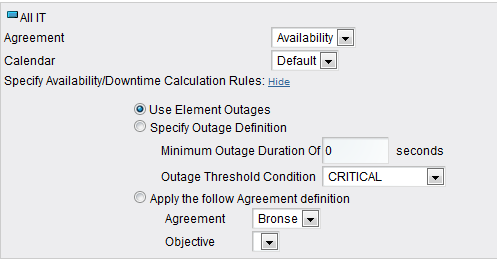
If reporting on availability or downtime, do the following:
-
Click the drop-down list, then select a calendar.
-
Specify Availability/Downtime calculation rules by selecting one of the following radio button options:
-
Use Element Outages to calculate outages in the report.
-
Specify Outage Definition which requires specifying a minimum outage duration and threshold condition.
Specify the minimum duration (in seconds) for outages to include in this report in the field.
Select the lowest severity level to include in this report from the list.
-
Apply Agreement Definition which requires selecting an agreement and an objective.
Select an agreement from the list. If the selected element has no associated agreements, then no agreement names display. Remote agreements are listed with the prefix “Remote.”
Select an objective from the list, or select to display all objectives. If the selected agreement has no associated objectives, no objective names display.
-
-
-
Under , select one of the following time selectors:
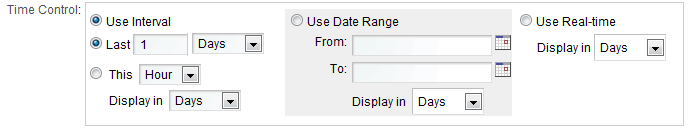
Use Interval: Use the various options to select an interval range for the report to run against. Time intervals are always determined relative to the time that the report is run.
Use Date Range: Use the various options to select a specific start and end time for the report to run against. Click the
 () icon to select a date/time.
Use Real-Time: (Agreements only) Reports on real-time data (only available if reporting on health and compliance and an agreement is selected in the drop-down list).
-
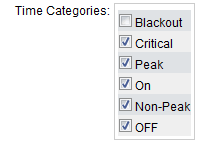
Under , indicate the time categories for the report to run against by selecting the check boxes.
-
Click the drop-down list, then select the tab for the report to use as the default report page.
-
Select any of the check boxes options to enable various report features:
Show Header Information: Displays the summary header information in the box at the top of each tab. The header information includes calendar and time category selections, overall health or downtime or availability metrics, and the overall data available and data relevance indicators.
Show Root Cause: Includes the tab in the report. Only applies to health and compliance for Agreements.
Show Breaches: Includes the tab in the report. Only applies to health and compliance for Agreements. Also, select from the following options:
-
Show Objective Breaches: Displays objective breaches in the tab.
-
Show Major Breaches: Displays major condition breaches, which are breach warning alarms, in the tab.
-
Show Cleared Breaches: Displays cleared breaches in the tab. Excluding cleared breach alarms eliminates all warning and violation breaches associated with a cleared breach alarm. Only applies to health and compliance reports.
-
Show Breach List: Displays a detailed list of all breaches in the tab. By default, shows breach violations (CRITICAL) only. Includes cleared and warning (MAJOR) breaches based on and selections. Only applies to health and compliance reports.
Show Details: Includes the tab in the report. Only applies to health and compliance for Agreements.
Show Charts: Includes the tab in the report.
Show Outages: Displays the tab. Also, select from the following options:
-
Show outages not generated by element condition changes: Includes manually entered or imported outages, as well as system generated outages (for example, based on real-time state data) when reporting on downtime, availability, and agreement or objective health.
-
Show Outages List: Displays a detailed list of outages in the tab. Outages include only those outages that start in the report interval.
Show Options: Displays options for the user viewing the report to change the time intervals and time categories in the report.
-
Show Calendar: Displays a calendar under that allows users to select to run the report using a different calendar than the one selected in Edit mode. must be selected for this option to have any effect.
Show PDF Link: Displays a link to save the report in PDF format.
-
-
Click the drop-down list, then select the time zone for the report to use in presenting data.
-
Click .
If you exit without clicking first, your changes are lost.
-
If this report is to be run automatically on scheduled intervals, click , then click to configure the report to run at regular intervals.
For more information about , see Section 7.8.5, Scheduling Portlets.
9.2.2 Using the SLA Compliance Portlet
While viewing the portlet, do any of the following:
-
Click any of the available tabs (, , , , , or ) to change the display to that view.
-
Click to navigate to the next or the previous time period for the given report.
-
Click
 to return to the default home view of the report as defined in .
-
Click
 to print the report.
-
Click
 to save the report as a PDF file.
-
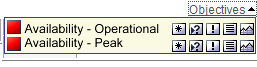
Click to view objectives related to the SLA. A tool tip displays with information on the objectives. Click the icons to view compliance, root cause, breaches, details or charts for the objective.
-
Click to runs an ad hoc query. The panel opens, as shown in the following figure:
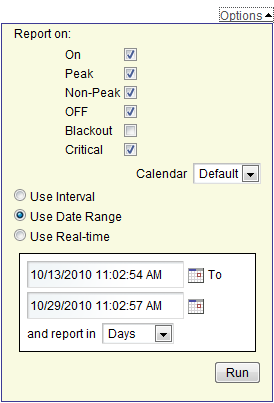
For more information, see Section 9.2.3, Regenerating the Report with Ad-Hoc Options.
9.2.3 Regenerating the Report with Ad-Hoc Options
While viewing the portlet, there are various on-the-fly options that can be used to modify and rerun the report. These options are available if is enabled in .
The selections do not change the original report options as set in or . They are used only for the immediate view. When the view is changed or the session expires, these selections are not retained.
To change the time categories, calendar or reporting ranges for the portlet:
-
Click the link.
-
Use the check boxes to select or clear any time categories.
-
Click the drop-down list, then select a calendar to use for filtering time categories.
-
Select one of the following radio buttons to adjust the time reported on:
-
Use Interval to select a date interval, such as the last 30 days.
-
Use Date Range to select a date range.
Select the time to report on: minutes, hours, days, weeks, months, or years.
-
Use Real-Time to report on real-time data (only available if reporting on health and compliance for an agreement.
-
-
Click to run the report with the new selections.