5.2 Understanding the Report View
The Report view tab provides the results of a completed Diagnosis.
The Results table appears first, providing a summary of the values Vivinet Diagnostics calculated by measuring simulated VoIP traffic sent over the network between the Target Devices. The Mean Opinion Score (MOS) and R-value Vivinet Diagnostics calculated are shown first to summarize the performance of the simulated traffic. Next, any delay, jitter buffer loss, or lost data values used to calculate the MOS are shown. For more information, see Section 5.2.1, Interpreting the Results Table.
The Diagnosis table summarizes the findings. In a Nortel environment, the table also includes an identification of the Probable Cause of a Diagnosis. Icons indicate the severity of any issues uncovered on the network between the Target Devices. Issues are aspects of the Diagnosis that differ from the performance results found in the Results table. An issue might be, for example, a router whose utilization statistics exceed an appropriate threshold, or a congested WAN link. Such findings are provided to help you troubleshoot the problem. For more information, see Section 5.2.2, Interpreting the Diagnosis Table.
NOTE:Vivinet Diagnostics generates diagnoses for all problems that match the instructions in its rules file: diagnostics.bin. If you do not want Vivinet Diagnostics to generate all possible diagnoses, you can alter the rules file to disable the unwanted diagnoses. For more information, see Section 6.4, Disabling Selected Diagnoses.
In addition to viewing results in the Report and Diagnosis tables, you can also generate the results in two different formats: the Report and the Raw Data file. Two buttons are displayed at the bottom of the Report view:
-
Report — provides a summary of the Diagnosis, showing how you defined the problem and naming the components or conditions that most directly contributed to the problem on your network. The Report is available in HTML format so you can view, print, and save it from your Web browser. For more information, see Section 3.8.1, Diagnosis HTML Report.
-
Raw Data File — provides the data Vivinet Diagnostics collected and used to make the Diagnosis. The Raw Data file is available in a comma-separated values (CSV) format so you can import it into a spreadsheet program, such as Microsoft Excel. For more information, see Section 3.8.2, Raw Data File.
5.2.1 Interpreting the Results Table
The Results table shows results from VoIP performance tests. These tests are more likely to succeed and to collect results for every VoIP performance measurement type if your problem definition included endpoints, or if you installed endpoints on the same subnet as the phones used as Target Devices. Even if they are not used as Target Devices, endpoints can conduct accurate VoIP performance tests while the Diagnosis is running.
Depending on your phone vendor, either the Results Performance tab or the Results Quality Stats tab is displayed.
Results Performance Tab
The first column of the Performance tab contains performance icons indicating whether call quality metrics met or fell below the performance thresholds configured for the Diagnosis. For more information, see Section 3.5.5, Setting Thresholds.
Without endpoints, Vivinet Diagnostics attempts to get performance measurements using Cisco IOS IP SLA, a Cisco active call query (an SNMP query of router tables), or Nortel RTPStatShow. But if Vivinet Diagnostics cannot obtain results for a particular performance metric, the Performance tab shows “n/a” to indicate the statistic was not available. For more information, see Section 5.3, Reviewing Factors in VoIP Performance Diagnoses.
Consider the following when you scan the Performance tab:
-
A result of “n/a” (not available) in the Measured Value column could indicate several scenarios in which a VoIP test was not attempted. The most common scenarios are described below:
-
You used phones instead of endpoints as Target Devices. Or you did not install endpoints in the same subnet as the phones. Endpoints can gather every metric needed to calculate the results shown here. Vivinet Diagnostics cannot collect them all without endpoints.
-
No router, or only one router, was found between the Target Devices. This scenario is applicable only when Vivinet Diagnostics was attempting a Cisco IOS IP SLA test between routers. A minimum of two routers is required for Cisco IOS IP SLA testing.
-
Vivinet Diagnostics could run the necessary VoIP performance tests only in a single direction between the Target Devices. Tests must be run in both directions to get aggregate measurements.
-
No SNMP community string with read/write access was provided. This scenario is applicable only when Vivinet Diagnostics was attempting a Cisco IOS IP SLA test between routers.
-
The Diagnosis ended before the VoIP test was attempted.
-
-
For most diagnoses between Cisco devices or NetIQ Performance Endpoints, the values shown in the Performance tab represent aggregated measurements from performance tests run in two directions to mimic bi-directional VoIP call traffic. But when Cisco active calls are discovered in a VoIP-to-POTS phone Diagnosis, values for active calls reflect one-way measurements only. Delay, jitter buffer loss, and lost data are one-way metrics based on the delay metrics, and early, late, lost, and received packets (on their way to the POTS phone) detected by the voice gateway.
-
For diagnoses between Nortel devices, the values shown in the Performance tab are gathered in one of two ways:
-
Diagnosis triggered by AppManager Knowledge Script. The AppManager NortelCS_Alarms Knowledge Script can launch the Action_DiagnoseNortelIPT script when one of the following SNMP trap is raised after a voice quality metric exceeds a designated threshold: QOS0022, QOS0024, QOS0026, QOS0028, QOS0030, QOS0032, and QOS0034. For more information, see Section 8.0, Working with NetIQ AppManager. Vivinet Diagnostics uses the voice quality metrics from the trap to create the Diagnosis statistics in the Performance and Quality Stats tabs on the Results table. However, it uses the metrics from RTPStatShow to populate the Quality Stats tab in the Phone details pop-up dialog box in the Path Trace of the Diagnose view.
-
Diagnosis triggered by Define view configuration. Vivinet Diagnostics collects voice quality metrics from RTPStatShow for both devices you configure in the Define view. It then determines which device has the worst voice quality. These “worst” values are used to create the Diagnosis statistics in the Performance and Quality Stats tabs on the Report table. The metrics from RTPStatShow also populate the Quality Stats tab in the Phone details pop-up dialog box in the Path Trace of the Diagnose view.
-
-
The performance metric that exceeded the threshold by the highest percentage is probably the cause of the problem. If a probable cause has been determined, it will appear in the Diagnosis table. However, always read the rest of the results from the Diagnosis. They may provide clues as to why that particular metric was so poor.
-
A MOS or call quality measured value of only 4.0 indicates tolerable, but not excellent, call quality. A MOS below 3.6 indicates conversation quality would be considered poor for many listeners. For more information, see Section 5.3.7, Mean Opinion Score.
-
With enough delay, a conversation can sound like a walkie-talkie, discouraging the speakers from talking out of fear of speaking simultaneously. For more information, see Section 5.3.3, Delay.
-
As a rule of thumb (or in this case, roughly an industry standard), jitter buffer loss values for a VoIP telephone call should remain below 0.5% of all datagrams sent if call quality is to remain high. For more information, see Section 4.2.5, Defining Jitter Buffer.
-
It is generally agreed that a lost data value greater than 1% usually indicates poor call quality, although loss of 0.5% to 1% also indicates some deterioration in quality. High loss values are typically caused by network congestion. For more information, see Section 5.3.6, Lost Data.
For each metric discussed in the Performance tab, Vivinet Diagnostics assigns VoIP performance ratings based on the thresholds you configured for the Diagnosis. For example, if you set a Good threshold of 1% for Lost Data, and performance tests turned up a 1.5% data loss statistic, you would see a “Marginal” icon, a yellow triangle, next to “Lost Data” in the Performance tab. For more information, see Section 3.5.5, Setting Thresholds.
Performance ratings comprise three categories:
|
Category |
Icon |
Explanation |
|---|---|---|
|
Good |

|
VoIP performance statistics fell within acceptable parameters. |
|
Marginal |

|
Reconfiguration or upgrades are necessary to achieve voice compliance or good call quality. |
|
Poor |

|
Call-quality statistics were not within acceptable parameters. |
Like the severity ratings in the Diagnosis table in the Report view, the performance ratings let you know at a glance if a problem exists on the network.
Results Quality Stats Tab
The Quality Stats tab appears only for diagnoses between Nortel devices. The contents of the tab varies depending on whether a trap event in AppManager triggered the Diagnosis or you defined the Diagnosis in the Define view. The following table defines all possible properties.
|
Quality Stats Tab Property |
Description |
|---|---|
|
Local Codec |
Codec in use at the source of the call. |
|
Local Avg Burst Density |
Average amount of burst density (a variation of data loss) on the source phone. For more information, see Section 5.3.1, Burst Density. |
|
Local Avg Burst Length |
Average length of a burst density period on the source phone. |
|
Local Gap Density |
Percentage of packet loss during a gap period, the period of time between bursts, for the source phone. |
|
Local Gap Length |
Length of a gap period for the source phone. |
|
Local Avg Noise Level |
Average level of interference present at the source phone. The lower the value, the less background noise present. |
|
Local Avg Signal Power |
Average signal strength for all received packets at the source phone. The higher the value, the stronger the signal. |
|
Local Round Trip Time Avg |
Average length of time for a call to travel to the destination phone and back. |
5.2.2 Interpreting the Diagnosis Table
The following definitions help you analyze the contents of the Diagnosis table of the Report view: Probable Causes and Diagnoses. Where appropriate, information is included to help you begin troubleshooting the problem.
When Probable Causes are available, the Diagnosis table is sorted by cause.
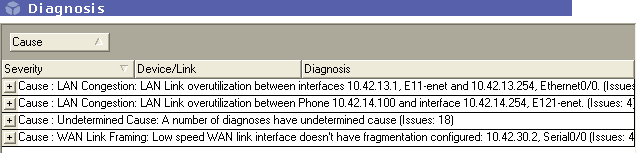
You can change how the table is sorted by dragging a column heading up to the dark gray area of the table. Drag the column heading back to the table to return to the default sorting order. To change the order in which columns are displayed, drag a column to a new position in the table.
Related Topics
Probable Cause Definitions
The Diagnosis table may include the Probable Cause of an associated Diagnosis of Nortel devices. The cause indicates which network problem is the source of poor VoIP quality, as indicated by the Diagnosis, and tells you where to look to fix the problem.
The Probable Cause in a Nortel Diagnosis is provided by Proactive Voice Quality Management (PVQM), a solution Nortel co-developed with NetIQ that gives network managers the ability to ensure the overall quality of their IP Telephony deployments. PVQM continuously and passively measures the user Quality of Experience (QoE) for all IP telephony communications, conducts system health checks for IP telephony servers, and provides troubleshooting and resolution for any performance degradation or fault conditions.
Not every Diagnosis is associated with a Probable Cause, but every cause is associated with at least one Diagnosis. The following list describes every possible Probable Cause.
|
Probable Cause |
Definition |
|---|---|
|
Duplex configuration |
The indicated link has a duplex configuration problem. At least one of the interfaces has been operating in half-duplex mode, which is inappropriate for VoIP traffic. Full-duplex mode, sending and receiving simultaneously, is recommended for VoIP traffic. Half-duplex mode has resulted in your Diagnosis of congestion, burst density, and/or data loss. A very common situation is one in which a VoIP phone is configured to auto-negotiate speed and duplex settings, while its corresponding switch port is configured as full duplex. In this scenario, the phone defaults to using half-duplex mode. Most vendors recommend configuring interfaces to auto-negotiate. If that is not possible, configure full-duplex mode for all of your interfaces. |
|
WAN link without QoS |
QoS is not provisioned properly. The indicated interface either had a QoS setting that assigns VoIP traffic a lower priority than recommended, or had no QoS setting at all. Review the individual diagnoses to determine which QoS settings are incorrect. The help for each Diagnosis contains additional information. Follow your network vendor’s recommendations for configuring VoIP QoS. |
|
WAN link speed - framing |
A low-speed (less than 1024kbps) WAN link interface is not configured to support fragmentation (framing) and interleaving (LFI). LFI reduces VoIP delay and jitter by breaking up large datagrams and interleaving VoIP datagrams with the resulting smaller datagrams. The lack of fragmentation and LFI has resulted in your diagnoses of jitter buffer loss and/or burst density. Configure your WAN links to use LFI and fragmentation. Refer to your network vendor’s documentation for instructions. |
|
Frame relay multiplexing |
Inappropriate frame relay traffic shaping is the cause of your jitter, lost data, and/or burst density diagnoses. Traffic shaping determines which packets are dropped due to congestion and which packets receive priority. Correctly configure the committed information rate on your frame relay devices. Refer to your network vendor’s documentation for instructions. |
|
WAN link congestion |
The indicated interfaces have not been configured with sufficient bandwidth to ensure a quality VoIP transmission. Insufficient bandwidth has resulted in your diagnoses of lost data, jitter buffer loss, and/or burst density. Ensure you have properly configured QoS and LFI (fragmentation and interleaving) across the WAN. Review the bandwidth requirements for VoIP and other applications. If your WAN does not have sufficient bandwidth for your needs, try tuning the applications to reduce the needed bandwidth. For example, you can configure a different codec, albeit at the expense of voice quality. |
|
LAN link congestion |
Either link utilization is high or QoS has not been configured for the indicated interfaces. Link congestion has resulted in your diagnoses of lost data, jitter buffer loss, and/or burst density. Ensure you have properly configured QoS or duplex settings across your LAN links. Excessive broadcast traffic is another reason for congestion. Minimize the use of applications that use broadcast traffic. Ensure your LAN bandwidth can handle the amount of application traffic, VoIP or otherwise. |
|
Undetermined cause |
Vivinet Diagnostics has uncovered a Probable Cause of your VoIP problem that cannot be grouped with any of the other Probable Causes. Although its category is undetermined, the cause still merits investigation. |
Diagnosis Definitions
Diagnoses describe the what, where, when, and severity of a condition in the network. In other words, a Diagnosis describes a symptom. The following list describes every possible Diagnosis.
|
Diagnosis |
Definition |
|---|---|
|
ACOM |
Short for ACombined, the ACOM value (measured in decibels) is equal to ERL + ERLE (Echo Return Loss Enhancement) for the indicated call leg. ERLE is the amount of echo provided by an echo canceller. The Diagnosis detected either the average or standard deviation ACOM value failed to meet the threshold for an active or recent POTS call leg. For more information, see Section 3.5.5, Setting Thresholds. |
|
Asymmetric routing |
When traceroute tests were run between the Target Devices, the identified paths for each direction were different. The paths differed because the path in one direction included more links, or because the path in each direction involved different device interfaces. The differences indicate an asymmetric network configuration. Asymmetric routing may point to a loop in your network and can degrade VoIP call quality because the conversation may take longer to travel from one conversant to the other, creating a “walkie-talkie” effect (delayed speech). If you run a Diagnosis using endpoints on multi-homed computers — computers that use multiple network adapters — you may see this Diagnosis. A multi-homed endpoint computer actually bridges network segments, so you will receive an “asymmetric routing” Diagnosis if the Path Trace in each direction produces a different, although valid, route. In such a case, the Diagnosis does not necessarily indicate a problem. |
|
Broadcast traffic |
At least one interface along the path between the Target Devices has received a fairly large number of broadcast packets, as a percentage of all packets received recently. Broadcast packets, sent over an Ethernet segment by shared media, such as printers, to advertise services, are seen by all nodes on the LAN segment and can create congestion. Routers can be configured to drop them. Further segmenting the network using a router can help reduce broadcast traffic. |
|
Burst density |
A variation of data loss, burst density is the longest sequence of data, beginning and ending with a loss, during which the number of consecutive received packets is less than the threshold. Bursty packet loss has a severe impact on VoIP call quality. Even if the average packet loss rate for a call is low (say one percent), the lost packets are likely to occur during short dense periods, resulting in short periods of degraded quality. For more information, see Section 5.3.1, Burst Density. |
|
Call failure |
A search of CallManager Call Detail Records found a phone call that failed between the Target Devices. For more information, see Section A.0, Cisco Unified CallManager Termination Codes. |
|
Configuration |
Vivinet Diagnostics detected a configuration problem with a VoIP device. For example, a router may not be configured to handle the QoS settings you selected in the Define view. A configuration problem may be diagnosed due to a number of different issues. The salient one is indicated in the Diagnosis table. The following are definitions of these issues.
|
|
Congestion |
May be diagnosed due to a number of different issues. The salient one is indicated in the Diagnosis table and defined below. Occasionally a Diagnosis of “Congestion” might be based on inaccurate information. You may have incorrectly configured an interface’s bandwidth by using the Cisco IOS “bandwidth” command. If the bandwidth value in the device MIB is lower than the device’s actual bandwidth, Vivinet Diagnostics might conclude that the interface is congested, even if it is not. To avoid this problem, keep the “bandwidth” value up to date. Following are definitions of the issues that may have led to a congestion Diagnosis. The term “device” here is interchangeable with “interface.”
|
|
Congestion |
|
|
CPU utilization |
Vivinet Diagnostics calculates CPU utilization from one-second, five-second, and one- and five-minute samples and then reports a maximum percentage (to show spikes in utilization), an average (to give a sense of normal utilization), or a standard deviation (to give a sense of the frequency of spikes in utilization). For more information, see Section 5.3.2, CPU Utilization. |
|
Delay |
One of the greatest impairments of call performance, delay can be measured on a link or device on the network between the Target Devices. For more information, see Section 5.3.3, Delay and Section 1.1, How Vivinet Diagnostics Works. |
|
Device did not respond |
The operation failed when Vivinet Diagnostics attempted to gather data from a network device, a phone, a CallManager, a Signaling Server, or a Call Server. Often this Diagnosis indicates you need to do some extra configuration. For more information, see Section 3.5.1, Configuring SNMP Permissions. If any error message was provided as part of the Diagnosis, click View Error Log in the Diagnose view to find out what happened. |
|
Down recently |
The number of seconds of uptime reported by the indicated device or interface indicates it has been down within the past hour. The device or interface that was recently down may have caused the VoIP problem you are diagnosing. |
|
ERL |
Echo Return Loss is the ratio of the power level of the transmitted voice signal to the power level of the echo signal generated by the VoIP gateway. The Diagnosis detected either the average or standard deviation ERL value failed to meet the threshold for an active or recent POTS call leg. For more information, see Section 3.5.5, Setting Thresholds. |
|
High hop count |
The Diagnosis detected a large number of router hops between the Target Devices. Network configuration may be an issue, or the routers that usually carry this traffic were down. |
|
Incomplete path |
Vivinet Diagnostics was unable to determine the complete path between the devices you specified because the indicated device did not respond to traceroute queries. |
|
Insufficient bandwidth |
The bandwidth detected on the indicated device or link fell below the Marginal threshold for insufficient bandwidth. For more information, see Section 5.3.4, Insufficient Bandwidth. |
|
Jitter buffer loss |
Jitter refers to excessive variation in delay values among datagrams in a single transmission. Jitter buffers smooth out these variations by holding some datagrams to feed them to the application sequentially. Datagrams not contained by the jitter buffer due to excessive delay variation would be lost to the application and are thus called jitter buffer lost datagrams. This statistic includes datagrams with delay too great for the jitter buffer you set (“overruns”) as well as those that arrive too quickly, while the jitter buffer is still full, and must be discarded (“underruns”). For more information, see Section 4.2.5, Defining Jitter Buffer. |
|
Lost data |
May be diagnosed due to a number of different issues, but the pertinent one is indicated in the Diagnosis table. For more information, see Section 5.3.6, Lost Data. The following are definitions of these issues. The term “device” here is interchangeable with “link” or “interface.”
|
|
Memory utilization |
If the memory utilization is maximized on a switch or router, calls may be processed more slowly, and network delay may increase. The affected memory pool is indicated. Memory utilization should remain below 90% for high-quality VoIP calls. |
|
MOS estimate |
A MOS estimate (as converted from an R-value) failed to meet the MOS threshold. The estimate was either calculated during a VoIP test, a Cisco IOS IP SLA operation, or a Ping test, or it was reported by the Nortel R-value trap or RTCP-XR. For more information, see Section 5.3.7, Mean Opinion Score and Section 5.3.9, R-value. |
|
No bandwidth |
Circuit throughput was insufficient to allow test VoIP traffic. For more information, see Section 5.3.4, Insufficient Bandwidth. |
|
No connectivity |
Test traffic sent by Vivinet Diagnostics was unable to traverse the indicated network segment because the network was down. A router, switch, or target is probably offline or powered off. |
|
No likely causes |
No issues were detected. All metrics conformed to expectations for high-quality VoIP traffic. |
|
Phone down |
The “phone down” Diagnosis varies slightly depending on the phone vendor you selected:
|
|
Recent error |
Queries sent to the Target Device’s CallManager determined the phone has recently reported an error. For more information, see Section A.0, Cisco Unified CallManager Termination Codes. |
|
R-value |
The R-value failed to meet the threshold you set. R-value is a call quality score derived from delays and equipment impairment. R-value is either reported by RTPStatShow or it is calculated during a VoIP test, a Cisco IOS IP SLA operation, or a Ping test. For more information, see Section 5.3.9, R-value. |
|
Signal errors |
The voice gateway indicates signal errors occurred before or during a Diagnosis. |
|
Signal level |
Vivinet Diagnostics identifies the input and output signal levels from the telephony interface used by the active POTS call leg. Signal levels are measured in decibels relative to one milliwatt. The Diagnosis detected either the average or standard deviation values for input and output signal levels failed to meet the threshold for an active POTS call leg. For more information, see Section 3.5.5, Setting Thresholds. |
|
Too many links |
Simulated VoIP traffic traversed an excessive number of network links, which could cause excessive delay. |
|
Unstable routing |
When traceroute tests were run multiple times in each direction between the Target Devices, the identified network paths changed. The disparities indicate an unstable or variable routing pattern, which is most likely to occur over a WAN link. Network congestion can cause unstable routing, which can result in the loss of router control packets. If routing patterns are unstable, related issues may be increased by delay and/or jitter. A Diagnosis of unstable routing may also be generated if your network is experiencing unusually high traffic, thereby causing traceroute requests to be discarded. This situation is probably a short-term problem with your network. |