5.1 Reviewing Path Trace Components
As soon as you initiate a Diagnosis, Vivinet Diagnostics attempts to determine which devices and links lie between the Target Devices you selected. If your Target Devices are endpoints, or if endpoints are installed in the same subnet as the phones you selected, Vivinet Diagnostics sends simulated VoIP RTP traffic between the devices. The traffic acts as a traceroute test to find routers or voice gateways in the path between the Target Devices. Using CDP, SONMP, or LLDP, the traffic finds any switches in the path. For more information, see Section 1.1, How Vivinet Diagnostics Works.
Vivinet Diagnostics relies on a series of Cisco Ping and IOS IP SLA tests, or the Nortel R-value trap and RTPStatShow command, to find devices in the path when no endpoints are installed.
NOTE:An RTP traceroute is available only when the detected endpoints are at least version 4.5. If the endpoints are earlier than version 4.5, the traceroute defaults to the ICMP protocol.
As results about network devices and links become available, Vivinet Diagnostics builds them into the graphical Path Trace, a picture of your network that distinguishes between switches and routers, and begins and ends with your Target Devices. Click any router or switch to find out more information about it, such as its manufacturer or operating system. Select Outgoing or Incoming above the Path Trace to change the direction of the path as it is shown.
The Path Trace numbers each link in the path between the Target Devices. This number becomes the “position” of the link, used as an identifier in the Diagnosis table and in the Report. Use the Path Trace to keep track of each link’s position so you can better understand the Diagnosis and determine the location of any issues it uncovered.
If network issues are found, the Path Trace displays an icon indicating their severity. Three levels of severity are indicated, depending on the degree to which a performance metric exceeds one of the thresholds you configured or one of the Vivinet Diagnostics thresholds. You can, for example, set a threshold to determine how much data loss triggers a severity of “Warning.” Similarly, Vivinet Diagnostics’ internal logic determines when the number of network links the simulated VoIP traffic had to traverse is excessive and presents a Diagnosis of “Too many links.” Click a severity icon for more information about the flagged issue. For more information, see Section 5.1.9, Severity.
From any device, link, or severity properties dialog box, press [F1] to view definitions of the data shown and get help with diagnostic information.
NOTE:If you run a Diagnosis between endpoints connected only by switches, in other words, there are no routers in the path, your Diagnosis produces a Path Trace showing the source and destination endpoints with no devices between them. Vivinet Diagnostics still generates metric data, but does not generate a warning or error about an empty path.
Related Topics
5.1.1 Endpoint Properties
Vivinet Diagnostics displays the following properties for endpoints in the graphical Path Trace in the Diagnose view. Where applicable, the property’s abbreviation, which also appears in the Raw Data file, is indicated in parentheses.
 Click the Endpoint icon to display the Properties dialog box.
|
Endpoint Property |
Description |
|---|---|
|
Name |
Domain name assigned to the endpoint computer |
|
Physical Address (physaddr) |
Endpoint computer’s MAC address, the physical-layer (OSI Layer 1) address of its NIC card |
|
IP Address (ipaddr) |
Endpoint computer’s IP network address |
|
Endpoint Version |
Should be 4.5 or later to support Vivinet Diagnostics functionality |
|
Operating System |
The operating system of the endpoint computer. |
5.1.2 Link Properties
Vivinet Diagnostics displays the following properties for links in the graphical Path Trace in the Diagnose view. Some properties are switch-specific, others are router-specific.
Click the link between two devices to display the Properties dialog box. When Layer 2 devices are present, the dialog box displays two tabs of information.
|
|
When a link connects a gateway with a POTS (plain old telephone service) phone, the dialog box presents two different tabs: Properties and POTS Interface.
The following definitions indicate the property’s abbreviation, which also appears in the Raw Data file. Not all properties appear on each tab. Therefore, the following table lists the properties in alphabetical order to simplify your search for a definition.
|
Link Property |
Description |
|---|---|
|
Bearer Channel |
Type of bearer channel associated with the POTS interface: slot, port, or channel. Bearer channels are the channels in a T1 or E1 circuit that carry phone calls. |
|
Link State |
Status of the link associated with the POTS interface, such as inactive or active. |
|
Delay |
One-way delay measured for VoIP traffic — actual or simulated — on this link. Shown in milliseconds (ms). |
|
Egress Address (egress) |
IP address of the device through which traffic entered the link (that is, the transmission interface from which traffic exited the device at the beginning of the link). Should match a router or switch in the Path Trace. “Unknown” indicates SNMP access to the egress device was denied. |
|
Egress Description (ename) |
Default interface name assigned to a device at the time of installation. |
|
Egress Type |
Media type through which traffic entered the link (for example, Ethernet). “Unknown” indicates SNMP access to the egress device was denied. |
|
Egress VLAN |
Virtual LAN number, if any, from which traffic entered this link and exited the previous device. It is possible for this number to differ from the Ingress VLAN number. Hybrid switches and routing switches can accommodate a change of VLAN in a Layer 2 trace. |
|
Ingress Address (ingress) |
IP address of the device through which traffic exited this link (that is, the transmission interface going into the device at the end of the link). Should match a router or switch in the Path Trace. |
|
Ingress Description (iname) |
Default interface name assigned to a device at the time of installation. |
|
Ingress Type |
Media type through which traffic exited this link (for example, Ethernet). “Unknown” indicates SNMP access to the ingress device was denied. |
|
Ingress VLAN |
Virtual LAN number, if any, from which traffic exited this link and entered the next device. It is possible for this number to differ from the Ingress VLAN number. Hybrid switches and routing switches can accommodate a change of VLAN in a Layer 2 trace. |
|
Interface |
Position of a POTS interface along the link between the gateway and the POTS phone. It is a number iteratively assigned to an interface as a result of the way traceroute tests were run between the devices. Functions as an identifier for diagnostic purposes. |
|
Interface Type |
Type of physical media associated with the POTS interface, such as ISDN, T1, E1, FXO, or FXS. |
|
Port Number |
Slot and port number of the POTS interface. |
|
Position |
Position of a hop in the path between the Target Devices. It is a number iteratively assigned to a link as a result of the way traceroute tests were run between the devices. Functions as an identifier for diagnostic purposes. The position number for each link also appears in the Diagnosis table in the Report view. Position numbers in the graphical Path Trace may not match the numbers shown in the informational dialog box because position numbers identify either Layer 2 or Layer 3 links. The links shown in the Path Trace do not distinguish between layers. Instead, they show a path between the Target Devices through every intervening device, regardless of the layer at which the device functions. |
|
Signaling |
Identifies the type of signaling channel used by the POTS interface:
|
|
Signaling Errors |
Number of signaling errors for the POTS interface. |
|
Unordered Devices |
Comma-separated list of all unordered devices associated with a Layer 2 device. An unordered device is one for which Vivinet Diagnostics cannot determine its exact position in the path. Layer 2 links that do not support CDP or SONMP or do not have either enabled are not detectable by Vivinet Diagnostics. You must enable your Layer 2 devices. For more information, see Section 4.4.2, Device Configuration. |
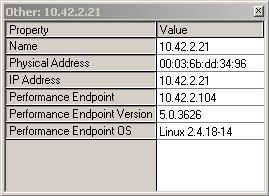
5.1.3 Other Properties
When Vivinet Diagnostics cannot identify a device, the “other” icon appears in the graphical Path Trace in the Diagnose view. If Vivinet Diagnostics is unable to determine whether the destination address is a phone, for instance a VGMC or a voice application such as Call Pilot, the destination address is labeled as “other.” Ensure you have completely configured your Call and Signaling Servers. The configuration information will help Vivinet Diagnostics identify the devices in your network. For more information, see Section 3.5.6, Configuring Nortel CS1000 Call and Signaling Servers.
The “other” category also provides details for Cisco CallManager Express devices. In this case, the Properties dialog box is titled “CCME” and contains two tabs of information: Properties and Phones. The definitions below indicate whether they apply to CallManager Express.
 Click the Other icon to display the Properties dialog box.
|
|
Other Properties Tab
|
Properties Tab Property |
Description |
|---|---|
|
Name |
Domain name assigned to the device |
|
Physical Address |
Device’s MAC address, the physical-layer (OSI Layer 1) address of its NIC card |
|
IP Address |
Device’s IP network address |
|
CCME Version |
Version of CallManager Express on the device |
|
Active Call Legs |
Number of active CallManager Express call legs at the time of the Diagnosis. This number matches the number of “offhook” designations on the Phones tab. |
|
Phones Seen |
Number of phones identified by the CallManager Express device, regardless of the phones’ registration status |
|
Phones Registered |
Number of phones registered to the CallManager Express device |
|
Performance Endpoint |
IP address of the Performance Endpoint installed closest to the phone and was therefore used to run VoIP performance tests to aid in diagnosing the problem. |
|
Performance Endpoint Version |
Should be 4.5 or later to support Vivinet Diagnostics functionality |
|
Performance Endpoint OS |
Operating system of the computer on which the endpoint is installed |
Other Phones Tab
|
Phones Tab Property |
Description |
|---|---|
|
Extensions/DNs |
Phone number for all phones associated with a CallManager Express device, which is identified in the Device Type field. |
|
Activity |
Indicates whether a CallManager Express phone is active (offhook) or inactive (onhook). The number of offhook phones matches the number of Active Call Legs on the Properties tab. |
|
Active DN |
Phone number active for a particular CallManager Express device. A device can have more than one phone number. |
|
User Name |
Name of the user on the active phone number. |
|
Registration |
Indicates whether the phone number is registered to the CallManager Express device. The number of registered phone numbers matches the number in the Phones Registered field on the Properties tab. |
|
Device Name |
Name of the CallManager Express device. |
|
IP Address |
IP address of the CallManager Express device. |
|
Device type |
Type of CallManager Express device. |
|
Key Phone? |
Indicates whether the CallManager Express phone number has been designated as a key phone. |
5.1.4 Phone Properties
Vivinet Diagnostics displays the following properties for phones in the graphical Path Trace in the Diagnose view.
 Click the Phone icon to display the Properties dialog box.
-
See Phone Properties Tab for definitions of the fields on the Properties tab.
-
See Phone Call Details Tab for definitions of the fields on the Call Details tab, which appears only for Cisco phones.
-
See Phone Quality Stats Tab for definitions of the fields on the Quality Stats tab, which appears only for Nortel phones.
These tabs may also contain fields for properties associated with POTS phone calls. You can find definitions of those fields in Active and Recent Call Legs Tabs and in Voice Gateway Performance Stats Section.
Phone Properties Tab
The following are definitions for each row of the Properties tab. Many fields are not populated for a PSTN (public switched telephone network) phone. The properties displayed vary according to the vendor of the phone you selected. If the phone did not respond to queries, the Properties dialog box displays no value for any property.
The names of properties differ for Cisco phones and Nortel phones. The following table describes them all.
|
Properties Tab Property |
Description |
|---|---|
|
Name |
DNS hostname you entered on the Define view. |
|
Internal Host Name |
Unique identifier assigned by Cisco. |
|
Call Server |
Nortel Call Server that handled the most recent call from this phone. |
|
Signaling Server |
Nortel Signaling Server that handled the most recent call from this phone. |
|
CallManager |
Cisco CallManager server that handled the most recent call from this phone. |
|
Publisher |
Cisco CallManager server the phone normally uses to make calls. |
|
SNMP Index |
Phone’s SNMP index in its CallManager. |
|
IP Address |
Network IP address of the phone. |
|
Subnet Mask |
IP network subnet to which the phone belongs. |
|
Terminal Number |
Terminal number assigned to the Nortel phone. |
|
Codec |
Voice codec the phone used to make calls. |
|
DNS Server |
Phone’s Domain Naming System server, which registers its location and allows it to find other servers and hosts on the network. |
|
HW Revision |
Hardware version. |
|
Extension |
Telephone extension assigned to this phone. For Nortel phones, the extension number is the same as the DN (directory number). |
|
Type |
Identification string assigned to the phone by its manufacturer. |
|
TFTP Server |
Phone’s Trivial File Transfer Protocol server. On a Cisco VoIP network, the TFTP server provides the phone with critical information on configuration updates and allows it to register itself on the network. |
|
Serial Number |
Phone’s serial number. |
|
Vendor |
Phone’s manufacturer. |
|
Version |
Phone’s firmware version. |
|
User |
Current user assigned to this phone. |
|
Status |
Phone’s current up or down status. |
|
Up Time |
Number of hours:minutes:seconds that have elapsed since the Nortel phone was last rebooted. |
|
Time of Last Registration |
Last time the phone registered with its CallManager. Because this information is not available for CallManager version 3.x, this field always indicates “n/a” for CallManager 3.x environments. |
|
Time of Last Error |
Time of the last error the phone reported. Because this information is not available for CallManager version 3.x, this field always indicates “n/a” for CallManager 3.x environments. |
|
Last Error |
Error code of the last error the phone reported. Because this information is not available for CallManager version 3.x, this field always indicates “n/a” for CallManager 3.x environments. |
|
Voice Gateway |
Voice gateway this phone uses to make PSTN calls. Applies only to PSTN phones. |
|
Gateway Router |
Default gateway router configured for this phone. |
|
Performance Endpoint |
IP address of the Performance Endpoint installed closest to the phone and therefore used to run VoIP performance tests to aid in diagnosing the problem. |
|
Performance Endpoint Version |
Version of the endpoint software. |
|
Performance Endpoint OS |
Operating system of the computer where the endpoint is installed. |
|
VRRP Master |
The management address of the current VRRP Master router for the virtual address of a gateway router (if the gateway router is a VRRP virtual address). |
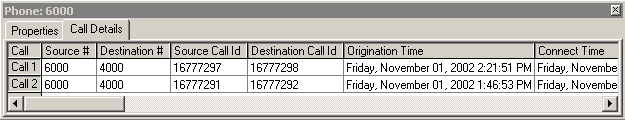
Phone Call Details Tab
The following are definitions of each column shown in the Call Details tab, which appears only for Cisco devices. Each type of information is taken from CallManager Call Detail Records (CDRs).
|
Call Details Tab Property |
Description |
|---|---|
|
Source # |
Phone number or extension that initiated the call. |
|
Destination # |
Phone number or extension that received the call. |
|
Source Call Id |
Identifier of the call traffic stream going from source to destination. |
|
Destination Call Id |
Identifier of the call traffic stream going from destination to source. |
|
Origination Time |
Time of day the call was attempted. |
|
Connect Time |
Time of day the call was actually connected. |
|
Disconnect Time |
Time of day the call was disconnected. |
|
Source Codec |
Codec used by the phone that initiated the call. |
|
Destination Codec |
Codec used by the phone that received the call. |
|
Termination Code |
CallManager-specific code that shows how the call was terminated. For more information, see Section A.0, Cisco Unified CallManager Termination Codes. |
|
Sent Packets |
Number of RTP packets sent between the phones during the call. |
|
Sent Octets |
Number of bytes sent between the phones during the call. |
|
Lost Packets |
Number of packets sent by one phone (during the call) never received by its partner phone. |
|
Avg Jitter |
Average jitter measured during the call. |
|
Avg Latency |
Average packet latency (delay) measured during the call. |
Phone Quality Stats Tab
The following are definitions of each row shown in the Quality Stats tab, which appears only for Nortel devices. Each type of information is taken from RTCP-XR and RTCP statistics returned by the latest sampling of RTPStatShow.
Call details vary depending on which version of the Nortel CS1000 firmware you are running. Unless otherwise noted, the following details are available for all supported versions.
|
Quality Stats Tab Property |
Description |
|---|---|
|
Local Codec |
Codec in use at the source of the call. This field appears only when a Nortel Diagnosis has been triggered by an event in NetIQ AppManager. For more information, see Section 8.0, Working with NetIQ AppManager. |
|
Local Listening R-value |
Call quality R-value for the source of the call as provided by RTCP-XR. RTCP does not provide an R-value. For more information, see Section 5.3.9, R-value. |
|
Local Avg Net Loss Rate |
RTCP-XR statistic used to compute a lost data value for the source phone. This detail became available in version 4.5. |
|
Local Avg Discard Rate |
RTCP-XR statistic used to compute a jitter buffer loss value for the source phone. This detail became available in version 4.5. |
|
Local Avg Burst Density |
RTCP-XR statistic used to compute burst density for the source phone. This detail became available in version 4.5. For more information, see Section 5.3.1, Burst Density. |
|
Local Avg Burst Length |
Average length of a burst density period on the source phone. This detail became available in version 4.5. |
|
Local Gap Density |
Percentage of packet loss during a gap period, the period of time between bursts, for the source phone. This detail became available in version 4.5. |
|
Local Gap Length |
Length of a gap period for the source phone. This detail became available in version 4.5. |
|
Local Avg End System Delay |
Average system delay for the source phone. System delay is the sum of jitter buffer and codec encoding and decoding. This detail became available in version 4.5. |
|
Local Avg Noise Level |
Average level of interference present at the source phone. The lower the value, the less background noise present. This detail became available in version 4.5. |
|
Local Avg Signal Power |
Average signal strength for all received packets at the source phone. The higher the value, the stronger the signal. This detail became available in version 4.5. |
|
Local Round Trip Time Avg |
Average length of time for a call to travel to the destination phone and back. This detail became available in version 4.5. |
|
Time Stamp |
Date and time of day RTPStatShow was used to collect call quality statistics. RTPStatShow provides the most recent set of quality statistics for a phone. Therefore, statistics could be for a phone call that just recently occurred, or for a call that happened days ago. |
|
Far End IP Address |
IP address of the destination device. |
|
Far End Port |
Port number of the destination device. |
|
Local Packets Sent |
Number of RTP packets sent by the source phone. |
|
Local Packets Received |
Number of RTP packets received by the source phone. |
|
Local Packets Received Out of Order |
Number of incorrectly sequenced RTP packets received by the source phone. |
|
Local Packet Loss |
Number of packets sent by the source phone never received by its partner phone. This statistic is provided by the RTCP-XR Avg Net Loss Rate value or the RTCP Packet Loss value. |
|
Local Avg Jitter |
Average jitter for the source phone. |
|
Local Latency |
Packet latency (delay) for the source phone. This statistic is provided by the RTCP-XR End System Delay value or the RTCP Latency value. |
|
Local Round Trip Time High |
Longest length of time for a call to travel to the destination phone and back. This detail became available in version 4.5. |
5.1.5 Router Properties
Vivinet Diagnostics displays the following properties for routers in the graphical Path Trace in the Diagnose view. If applicable, the property’s abbreviation, which also appears in the Raw Data file, is indicated in parentheses.
 Click the Router icon to display the Properties dialog box.
If the detected router did not respond to traceroute queries, the device icon on the Path Trace looks like a cloud, and the Properties box reads, “Device did not respond to traceroute queries.” The message “Device did not respond to SNMP queries” indicates Vivinet Diagnostics was unable to get information from the device using SNMP queries.
|
Router Property |
Description |
|---|---|
|
System Name (sysname) |
Internal administrative name (not the DNS hostname) for this device |
|
Layer |
Layer of the OSI model at which the router operates. Should be Layer 3 for routers. |
|
Contact |
Optional field in the device properties indicating the person or department to contact if the router needs servicing. |
|
Model |
Vendor and model number of the router |
|
OS Version (osversion) |
Version of the router operating system. Also indicates service packs, if any have been applied. |
|
Services |
List of the services supported by this device. Examples include Cisco Responder and VoiceGateway. |
|
Up Time |
Amount of time elapsed since the router was last rebooted |
|
Vendor |
Manufacturer of the router |
|
Location |
Internally configured. The place where the router is installed. |
5.1.6 Switch Properties
Vivinet Diagnostics displays the following properties for switches in the graphical Path Trace in the Diagnose view. If the switch detected in the path did not respond to SNMP queries, the Properties box reads “Device did not respond to SNMP queries.”
 Click the Switch icon to display the Properties dialog box.
|
Switch Property |
Description |
|---|---|
|
System Name |
Internal administrative name (not the DNS hostname) for this device |
|
Layer |
Layer of the OSI model at which the switch operates. Should be Layer 2 for switches. |
|
Contact |
Optional field in the device properties indicating the person or department to contact if the switch needs servicing. |
|
Model |
Vendor and model number of the switch |
|
OS Version |
Version of the switch operating system. Also indicates service packs, if any have been applied |
|
Up Time |
Amount of time elapsed since the switch was last rebooted |
|
Vendor |
Manufacturer of the switch |
|
Location |
Internally configured. The place where the router is installed |
|
The following properties appear in the Switch properties dialog box when the switch is unordered. For more information, see Section 5.1.7, Unordered Devices. |
|
|
Egress Description |
Default interface name assigned to a device at the time of installation |
|
Egress Type |
Media type through which traffic entered the switch, for example, Ethernet. “Unknown” indicates SNMP access to the device containing the egress was denied. |
|
Ingress Description |
Default interface name assigned to a device at the time of installation |
|
Ingress Type |
Media type through which traffic exited the switch, for example, Ethernet. “Unknown” indicates SNMP access to the device containing the egress was denied. |
|
L3 Link Position |
Position of a Layer 3 hop in the path between the Target Devices associated with this switch. It is a number iteratively assigned to a link as a result of the way traceroute tests were run between the devices. Functions as an identifier for diagnostic purposes. The position number for each link also appears in the Diagnosis table in the Report view. Position numbers in the graphical Path Trace may not match the numbers shown in the informational dialog box because position numbers identify either Layer 2 or Layer 3 links. The links shown in the Path Trace do not distinguish between layers. Instead, they show a path between the Target Devices through every intervening device, regardless of the layer at which the device functions. |
5.1.7 Unordered Devices
Vivinet Diagnostics may not be able to identify the location of some devices in the path. For instance, if you have not configured some Layer 2 devices, Vivinet Diagnostics cannot precisely pinpoint their location. Icons representing the unordered devices appear in a panel below the Path Trace.
Whether a device is ordered or unordered is irrelevant to the results of the Diagnosis. The Unordered Devices panel merely helps you visualize the Layer 2 path taken by voice packets.
Click each device in the panel to reveal the properties, which vary depending on the type of device.
NOTE:A device can appear twice in the Unordered Devices panel. Duplication can occur when the device is in the Layer 2 path on the left and right sides of the trace. In other words, the device exists between the source target and the source target’s router as well as between the destination target and the destination target’s router.
For more information, see Section 4.4, Understanding Layer 2 Trace.
5.1.8 Voice Gateway Properties
Vivinet Diagnostics displays the following properties for voice gateways in the graphical Path Trace in the Diagnose view. If applicable, the property’s abbreviation, which also appears in the Raw Data file, is indicated in parentheses.
 Click the Voice Gateway icon to display the Properties dialog box.
A voice gateway provides so much information about the gateway and its call legs and dial peers that the Voice Gateway Properties dialog box is divided into tabs and sections, making the information easier to find.
Voice Gateway Properties Tab
The Properties tab presents basic information relating to the voice gateway itself.
|
Properties Tab Property |
Description |
|---|---|
|
System Name (sysname) |
Internal administrative name (not the DNS hostname) for the voice gateway |
|
Layer |
Layer of the OSI model at which the voice gateway operates |
|
Contact |
Optional field in the device properties indicating the person or department to contact if the voice gateway needs servicing |
|
Model |
Vendor and model number of the voice gateway |
|
OS Version (osversion) |
Version of the voice gateway’s operating system. Also indicates service packs, if any have been applied. |
|
Services |
List of the services supported by the voice gateway. Examples include Cisco Responder and VoiceGateway. |
|
Up Time |
Amount of time elapsed since the voice gateway was last rebooted |
|
Vendor |
Manufacturer of the voice gateway |
|
Location |
Internally configured. The place where the voice gateway is installed. |
Active and Recent Call Legs Tabs
The Active Call Legs and Recent Call Legs tabs contain all or some of the following properties. The data in the Active Call Legs tab relates to legs of calls active on the voice gateway at the time of the Diagnosis. The data in the Recent Call Legs tab relates to legs of calls that occurred during the last 15 minutes (approximately). Not all fields in the tabs apply to both VoIP and POTS call legs. Fields display “n/a” if they do not apply to the call leg in question.
These tabs highlight all active and recent calls on the voice gateway, regardless of the PSTN phone number.
|
Call Legs Tabs Property |
Description |
|---|---|
|
Leg |
Unique numeric identifier for the call leg |
|
Type |
Indicates whether the call leg belongs to a VoIP or POTS segment |
|
Call ID |
Unique alphanumeric identifier for the call |
|
Dial Peer ID |
Numeric identification assigned to a dial peer in a voice gateway IOS configuration. |
|
Peer Number |
Called phone number Important The peer numbers you see may not be the same numbers you input for the Diagnosis. POTS phones, especially those with MGCP-configured gateways, may have dial peers whose pattern-matching fields are blank. Any phone number will match a blank pattern. In this scenario, all active or recent calls appear on the Call Legs tabs. |
|
Interface Name |
Name of the physical media interface mapped to the dial peer |
|
Interface Type |
Type of physical media interface mapped to the dial peer, such as FXO or FXS |
|
Call Origin |
Indicates whether the call leg originated or answered a call |
|
Duration |
For active calls, indicates the number of seconds the call has been active. For recent calls, indicates the total duration. |
|
Call Status |
Indicates whether the call is active or in the process of connecting |
|
Disconnect Cause |
Text string identifying why the call disconnected, usually “normal call clearing.” The actual value depends on the protocol and protocol version in use on the interface. |
|
Remote IP Address |
IP address of the VoIP dial peer, usually a CallManager |
|
Remote UDP Port |
UDP port number of the VoIP dial peer, usually a CallManager |
|
Session Protocol |
Name of the session protocol in use for the call leg, such as Other, Cisco, SDP, SIP, or Multicast |
|
Selected QoS |
QoS selected for the call leg. Can be bestEffort, guaranteedDelay, or controlledLoad. |
POTS and VoIP Dial Peer Tabs
A dial peer is a device that originates or receives a call in a telephone network. Dial peers are categorized as either voice-network dial peers or POTS dial peers. Voice-network dial peers include VoIP-capable computers, routers, and gateways within a network. POTS dial peers include traditional telephone network devices such as phone sets, cell phones, and fax machines.
There is one dial peer per call leg. The Dial Peer tabs highlight all peers defined in the voice gateway relevant to the direction of voice calls.
|
Dial Peer Tabs Property |
Description |
|---|---|
|
Peer ID |
Numeric identification assigned to a dial peer in a voice gateway IOS configuration. |
|
Dial Pattern |
String of characters, similar to a regular expression, used to match phone numbers with dial peers. A blank string matches any number and is normally associated with an MGCP gateway. |
|
Peer Media |
Identifies the type of physical network interface to which the logical interface is mapped. Can be VoIP, FXO, FXS, ISDN, T1, or E1. |
|
Peer Status |
Status of the dial peer at the time of the Diagnosis, such as active, not in service, or not ready. |
|
Session Target |
Destination of the dial peer, such as the IP address of the CallManager. |
|
Prefix Digits |
Digits to be sent to the telephony interface before the real phone number, such as country code 011. |
|
Forward Digits |
Number of digits from the dialed phone number that should be sent on to the destination phone number. |
|
Session Protocol |
Name of the session protocol in use for the dial peer, such as Other, Cisco, SDP, SIP, or Multicast. |
|
Desired QoS |
Requested QoS for the dial peer. Can be bestEffort, guaranteedDelay, or controlledLoad. |
|
Encapsulation Name |
Name of the voice encapsulation interface mapped to the dial peer. Voice encapsulation is the logical network interface created for each dial peer by the voice gateway, in essence, a mapping of the dial peer to its physical interface. |
|
Encapsulation Type |
Type of voice encapsulation interface mapped to the dial peer. Could be Voice or VoIP. |
|
Interface Name |
Name of the physical media interface mapped to the dial peer. |
|
Interface Type |
Type of physical media interface mapped to the dial peer, such as FXO or FXS. |
Voice Gateway Performance Stats Section
In addition to the data displayed on the Active Call Legs and Recent Call Legs tabs, Vivinet Diagnostics provides performance statistics for the legs of active and recent calls. Click View Performance Stats to expand the Voice Gateway Properties dialog box and review the additional statistics.
For each active call statistic, the Average, Minimum, Maximum, and Standard Deviation value is shown, as well as the time the minimum value occurred and the time the maximum value occurred. The values for the Time of Min and Time of Max fields represent the number of milliseconds that elapsed between the start of polling and the time the minimum or maximum value occurred.
For each recent call statistic, only the final Average value is shown. There are no final values for ERL, Signal In, and Signal Out. Recent calls do not record values for those statistics.
|
Performance Statistic |
Description |
|---|---|
|
ACOM |
Short for ACombined, the ACOM value is equal to ERL + ERLE (Echo Return Loss Enhancement) for the indicated call leg. ERLE is the amount of echo provided by an echo canceller. Measured in decibels. |
|
ERL |
For each call leg, Echo Return Loss is the ratio of the power level of the transmitted voice signal to the power level of the echo signal generated by the VoIP gateway. ERL varies greatly depending on the switched telephone network connected to the VoIP gateway. There will always be echo whenever you have an analog trunk line connected to a digital network. |
|
Signal In |
Active input signal level from the telephony interface used by the call leg. Measured in decibels relative to one milliwatt. |
|
Signal Out |
Active output signal level from the telephony interface used by the call leg. |
|
Round Trip Delay |
End-to-end delay, or latency, as measured on the call leg, in milliseconds. For more information, see Section 5.3.3, Delay. |
|
Jitter Buffer Loss |
Percentage of datagrams that overran or underran the jitter buffer during the call leg. For more information, see Section 5.3.5, Jitter Buffer Loss. |
|
Lost Data |
Percentage of datagrams lost during the call leg. For more information, see Section 5.3.6, Lost Data. |
|
MOS |
Mean Opinion Score (MOS) calculated for the call leg. For more information, see Section 5.3.7, Mean Opinion Score. |
5.1.9 Severity
The presence of a severity icon on the Path Trace in the Diagnose view indicates that Vivinet Diagnostics found issues that might affect the performance of VoIP calls on your network. The severity of an issue is determined by the threshold levels configured in the Thresholds dialog box, or by one of the Vivinet Diagnostics internal thresholds, which are derived from its rules about high-quality VoIP performance.
Severity levels are mapped to the thresholds you set for “Marginal” or “Good” performance. For example, if a performance metric recorded by a diagnostic test exceeds your Marginal threshold for Jitter Buffer Loss, the Path Trace shows the Error severity icon next to the device or link where the metric was recorded. If the metric meets or falls below your Marginal threshold while exceeding your Good threshold, the Path Trace shows the Warning icon. For more information, see Section 3.5.5, Setting Thresholds.
Severity may be one of three levels:
|
Severity Icon |
Meaning |
|---|---|

|
Error. Highest severity. Requires immediate attention. Click the icon to review details about the issue, such as Congestion: detected on an interface. 10.42.1.47, Ethernet0, reported an average of 1.334% packet collisions. |

|
Warning. Medium severity. Will probably adversely affect VoIP call quality. Click the icon to review details about the issue, such as Congestion: detected on an interface. 10.42.1.249, FastEthernet1/0, reported a multiple collision ration of 64.904%. |

|
Information. Lowest severity. Does not require immediate attention. Click the icon to review details about the issue, such as Configuration: problem detected on an interface. 10.42.1.249, FastEthernet1/0, does not have RTCP enabled. |