3.7 Diagnosing the Problem (Step 2)
In the Diagnose view, run a Diagnosis by clicking Start Diagnosis. The first time you start a Diagnosis, you may see the Verify SNMP Settings dialog box, which reminds you to provide the SNMP permissions currently in use on your network. The permissions allow Vivinet Diagnostics to gather information from your network devices. For more information, see Section 3.5.1, Configuring SNMP Permissions.
NOTE:Unless your network is still using default SNMP permissions, which creates a risky network security hole, you need to provide your network’s SNMP permissions information in the SNMP Properties dialog box so Vivinet Diagnostics can query your network devices. Click Verify in the dialog box to type this information.
The Diagnose view shows you how a Diagnosis is proceeding. The Status field is continually updated, and the green arrows remain in motion until the status reads “Diagnosis completed.”
After the Path Trace appears in the Diagnose view, icons represent the network devices in the path, and arrows indicate links between devices. Click a link or device icon to view identifying details about that device or link. A severity icon is displayed next to devices or links that have issues. Click the severity icons for information about the issue that has been detected. From any device, link, or severity properties dialog box, press [F1] to view definitions of the data shown and get help with diagnostic information.
If an error occurs, the View Error Log button is enabled. However, depending on the severity of the error, the Diagnosis may still complete. Click View Error Log to find out what happened. You then can stop the Diagnosis and change configuration parameters before starting it again. For more information, see Section 6.0, Troubleshooting.
Vivinet Diagnostics keeps track of the status of the Diagnosis and displays it in the window, along with the number of potential issues it has uncovered in your network. Devices having more than one Diagnosis display only one icon, so the number of issues may not correspond with the number of icons.
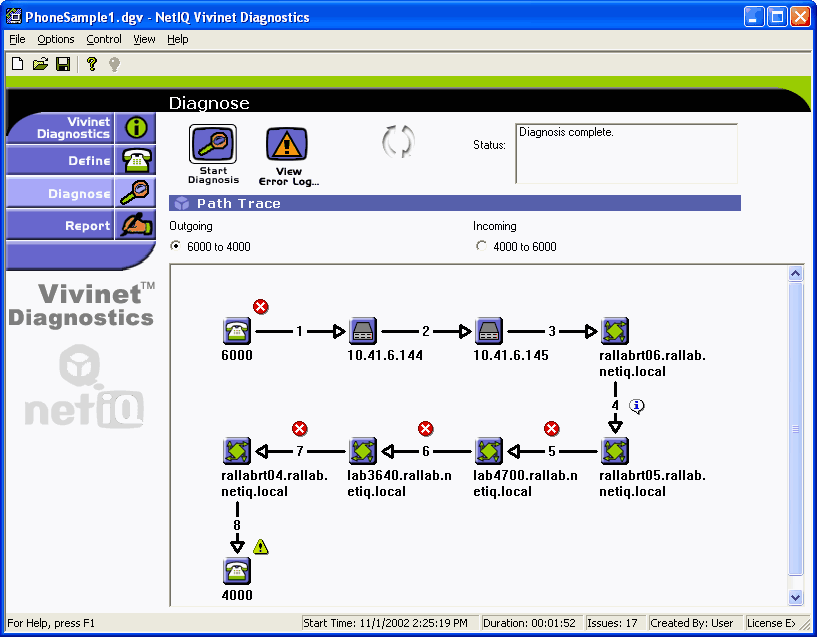
Although the Diagnose view lets you stop a Diagnosis that is in progress, Vivinet Diagnostics also stops the Diagnosis when all actions necessary to gather the appropriate information have been completed.
When you run a Diagnosis again, previous results are deleted.
|
Diagnose View Component |
Description |
|---|---|
|
Start Diagnosis button |
Starts the Diagnosis. Becomes a Stop Diagnosis button while a Diagnosis is running. |
|
View Error Log button |
Accesses the Error Log Viewer, which lets you sort and filter errors and analyze their causes. This button is enabled only if errors exist. For more information, see Section 6.3, Error Log Viewer. |
|
Status field |
The current status of the Diagnosis. The status reads “Diagnosis running” while the Diagnosis runs and “Diagnosis complete” when the Diagnosis has completed, as well as a list of all tasks that are performed. |
|
Path Trace |
A schematic diagram showing all devices and links that handle the VoIP traffic between the two Target Devices. Click the Outgoing and Incoming radio buttons to see the path in either direction. For more information, see Section 5.1, Reviewing Path Trace Components. |
|
Severity icons |
Indicate a potential problem has been found in a device or link. Click these icons to view details about each problem. Press [F1] for help and advice. |