10.3 Troubleshooting Different States
Access Gateway for Cloud displays indicators for the current state of the different components. The display refreshes every five minutes. Access Gateway for Cloud might not immediately display the change.
The following sections list the different components, the possible states, and troubleshooting steps you take when the state changes.
10.3.1 Front Panel of the Node
The indicator is the front panel of the node.
Figure 10-1 Front Panel

The states are:
Green: The node is healthy.
Yellow: The node cannot communicate with the other nodes within the five minute refresh.
Red: The node cannot communicate with the other nodes within two of the five minute refresh cycles.
Clear: The node is initializing or the state of the node is unknown.
Perform the following troubleshooting steps in the order listed if the state is anything but green.
-
Wait at least five minutes for the display to refresh and display the current state.
-
Click the node, then select Show Health.
Show Health displays which part of the appliance is having issues.
-
If Show Health displays a problem, use the troubleshooting tools to gather logs.
For more information, see Section 10.2, Troubleshooting Tools.
-
Reboot the appliance, then wait at least another five minute cycle for all nodes to display the current state.
10.3.2 Top of the Node
The indicator is the top of the node.
Figure 10-2 Top of the Node

The states are:
Green: All Apply commands complete successfully.
Red: The Apply commands did not complete successfully.
Perform the following troubleshooting steps in the order listed if the state is red.
-
Mouse over the top of the node to see the status of the last Apply command made on the node.
-
If there is not enough information to help in the summary, click Enter Troubleshooting Mode on the node, then mouse over the node again.
The troubleshooting mode displays a details summary the last Apply command made on the node.
-
Reboot the appliance, then wait at least another five minute cycle for all nodes to display the current state.
10.3.3 Identity Source
The indicator is the small identity source icon.
Figure 10-3 Small Identity Source
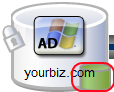
The states are:
Green: The connector to the identity source is healthy.
Yellow: The connector has communication problems with the identity source.
Red: The connector to the identity source is unhealthy or contains errors.
Clear: The connector to the identity source state is unknown.
Perform the following troubleshooting steps in the order listed.
-
If the connector is green, but users are not displayed in the Access Gateway for Cloud interface, verify that the identity source servers are up and communicating.
-
Use the troubleshooting tools to gather logs, then look at the identity source provisioning logs listed in Table 10-1 for errors. The ConnectorLogs.txt file maps the display name of the connector with the log name of the connector, if there is more than one identity source connector.
-
Click Show Health on the master node, then click Access Gateway.
If this item is yellow or red, the interface displays helpful information to help troubleshoot the issue.
-
If you are using LDAPS to communicate to Active Directory, refresh the certificates. You refresh the certificates by:
-
Log in to the Admin.html page, then click Configure on the Active Directory identity source.
-
Click the Refresh icon next to the Active Directory server.
-
10.3.4 SaaS Applications
The indicator is the small cloud on each SaaS application connector.
Figure 10-4 SaaS Application Indicator
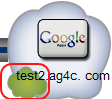
The states are:
Green: The connectors to the SaaS applications are healthy.
Yellow: The connectors to the SaaS applications contain warnings.
Red: The connector to the SaaS applications contain errors or cannot communicate with the SaaS applications.
Clear: The connectors to the SaaS applications are in an unknown state.
Perform the following troubleshooting steps in the order listed.
-
Click Show Health on the master node, then check the status of Provisioning.
If this item is yellow or red, there is helpful information displayed to help troubleshoot the issue.
-
Use the troubleshooting tools to gather logs, then look at the provisioning logs listed in Table 10-1 for errors.
-
Make a cosmetic change to the SaaS application connector configuration, then click Apply.
By forcing an Apply, the appliance refreshes the SaaS application connector state and this can resolve issues.