5.1 Overview
The Correlation capability in Sentinel provides security analysis with the ability to look for “known knowns” occurring within the enterprise in real time. Sentinel provides another way to analyze data by looking for the “known unknowns” in the events generated within the enterprise.
This second type of analysis is called Security Intelligence in Sentinel. It allows you to perform anomaly-based analysis so you can find deviations from the normal trends of your enterprise.
A key aspect in looking for deviations depends upon the nature of input data. Input data is typically a collection of various instances, records, or points. Each data instance itself consists of attributes that define the type of input. Examples of different types of input data within the SIEM domain are:
-
Spatial (location of various entities)
-
Graphical (relation between the various entities)
-
Sequences (time series)
The Security Intelligence feature in Sentinel focuses on statistical analysis of time series data to enable analysts to identify and analyze anomalies either by an automated statistical engine or by visual representation of the statistical data for manual interpretation. The following concepts collectively define the Security Intelligence feature in Sentinel:
5.1.1 Terminology
The following terminology is used with Security Intelligence:
Security Intelligence: The feature that allows you to create dashboards with baselines that define what is normal in your network. An analysis of the real-time data lets you see if there are any anomalies, and an e-mail is sent to notify someone that anomalies are occurring.
Dashboard: Displays data matching a particular filter, categorizes data using a particular classifier, and looks for particular anomalies as specified in the dashboard’s set of anomaly rule definitions. This is not just a front-end Web interface, but also a back-end engine because it is always looking for anomalies, even if the Web interface is not open.
Classifier: Determines the categories displayed in the dashboard.
Filter: Determines the scope of events displayed in the dashboard.
MongoDB: A database that stores the Security Intelligence data.
Category: A class or division of events with shared characteristics as defined by the classifier.
Anomaly: Something that deviates from what is standard, normal, or expected when compared to the user’s selected baseline.
Anomaly Definition: A set of principles, configurable by a user, that describes the threshold and circumstances as defined in the anomaly rules.
Chart: The graph in the dashboard that depicts the statistical data and baseline.
Time Slider: The Web interface component that allows a user to quickly visualize and navigate the time range of data.
Breakdown: The Web interface component that displays the top ten values of a select number of event fields to show a user details on the most prevalent event values in the data they are viewing.
5.1.2 How Security Intelligence Works
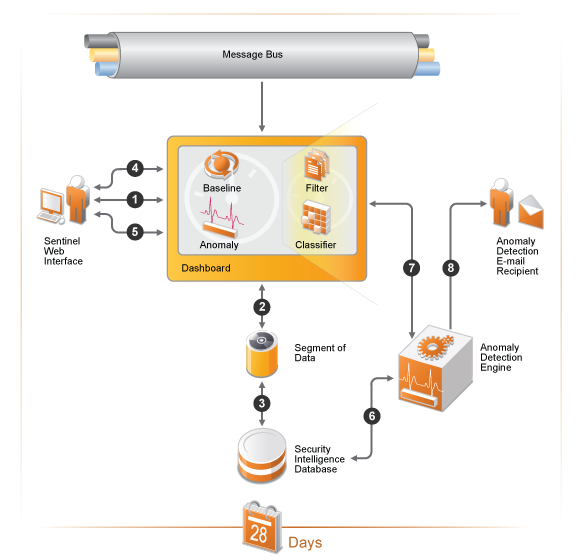
The following diagram depicts how the Security Intelligence feature works.
Figure 5-1 How Security Intelligence Works
-
A user creates a dashboard in the Sentinel Web interface.
-
The dashboard consists of a filter and classifier that create a segment of data from the normalized events in the message bus.
-
The segment of data is stored in the MongoDB database for up to 28 days.
-
The user then defines a baseline of normal activity for the environment.
-
The user creates anomaly definitions to look for real-time events that are occurring outside of the defined baseline.
-
The anomaly engine analyzes the events in the MongoDB database.
-
This information is displayed in the dashboard.
-
If an anomaly is detected, an e-mail is sent with the information about the anomaly.
5.1.3 Permissions for Security Intelligence
The Security Intelligence option is displayed in the Web interface if the user has one of the following permissions:
-
Manage and View Security Intelligence Dashboards
-
View Security Intelligence Dashboards
A user is assigned these permissions while creating a role. For more information, see Creating Roles
in the NetIQ Sentinel 7.0.1 Administration Guide.
Using the Security Intelligence option, you can view, create, and manage dashboards.