15.1 Security Analysts
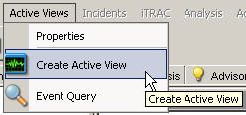
15.1.1 Active Views Tab
In the tab, you can monitor events as they happen, performing queries on these events. You can monitor them in a table form or through a 3-D graphical representation.
-
Select the tab.
-
Click .
-
Select a filter from the drop-down menu, then click .

-
Click . If you have an active network, you might see something similar to:

NOTE:To display a 3-D graph without real-time events, click the Display Events down-arrow and select No.
15.1.2 Exploit Detection
To view any events indicating a possible exploitation, you must have the following:
-
Advisor Feed
-
Intrusion detection
-
Vulnerability scanning
Figure 15-1 Severity, Vulnerability, and AttackId Columns

Within an event, the values in the field convey the following:
-
When the field equals 1, the asset or destination device is possibly exploited.
-
When the field equals 0, the asset or destination device is not being exploited.
-
When the field is blank, the exploit detection feature of Sentinel is not enabled.
To view events that indicate a possible exploitation, create an Active View with a filter where Vulnerability equals 1. For example, if you have Nmap and have run the Nmap Collector, you can view asset information on the exploited asset or any asset.
For more information on how exploit detection works and which intrusion detection systems and vulnerability scanners are supported, see Section 2.0, Sentinel Control Center.
15.1.3 Asset Data
To view Asset information for any event, right-click an event or events, then select .
A window similar to the one below displays:
Figure 15-2 Asset Report

15.1.4 Event Query
You can use an event query to find out if your system has been attacked. For example, during monitoring, you see numerous Telnet attempts from source IP 10.0.0.1 Telnet attempts could be an attack. Telnet potentially allows an attacker to remotely connect to a remote computer as if they were locally connected. This can lead to unauthorized configuration changes, installation of programs, viruses, and so on.
You can use an event query to determine how often this possible attacker has attempted a Telnet attack by setting up a filter to query for this particular attacker. For example, you know the following:
-
Source IP: 10.0.0.1
-
Destination IP: 10.0.0.2
-
Severity: 5
-
Event Name: Attempted_telnet
-
Sensor Type: H (Host Intrusion Detection)
To perform an event query:
-
In the Sentinel Control Center, click ( icon) and click the drop-down menu.
A window with a list of filters displays.
-
Click ; specify a filter name of Telnet SIP 10.0.0.1. In the field below the filter, specify:
-
SourceIP = 10.0.0.3
-
EventName = Attempted_telnet
-
Severity = 5
-
SensorType = H
-
DestinationIP = 10.0.0.4
-
Match if, select All conditions are met (and)
-
-
Click . Select your filter and click .
-
Provide your time period of interest, then click ( icon).
The result of your query displays. If your event query makes a match, you see a result similar to the following illustration.

If you want to see how often in general this user is attempting a Telnet, remove DestinationIP, SensorType and, Severity from your filter or create a new filter. The results show all the destination IPs this user is attempting to Telnet to.
If any of your events are correlated events, you can right-click to find what events triggered that correlated event.
NOTE:Correlated events have the SensorType column populated with a C.