12.9 Report Data Configuration
The Report Data Configuration option allows you to enable and disable summaries or aggregate tables in the Sentinel database. Enabling a summary allows aggregation to start computing the counts for that particular summary and shortens the execution time for any report that uses the summary table. Sentinel Top 10 reports use summary tables.
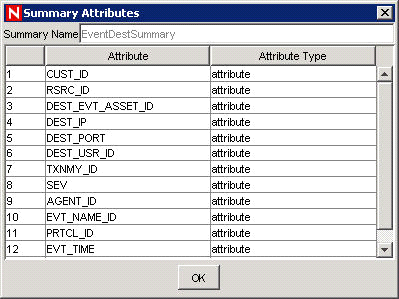
A summary is a defined set of attributes that make up the key for which to compute the number of unique occurrences (event count) by each hour time period (event time). For EventSevDestPortSummary, it saves the count of events for each unique combination of destination port and severity for an hour. These saved computations of the event data allow for quicker summary reporting and querying. Certain summaries need to be active in order for the summary reports to be accurate.
Aggregation is the process of calculating the running count for all active summaries as events flow through the system. These running counts are saved to the database in the summary tables.
Summaries Benefits:
-
Greatly reduced event data set
-
Conformed dimensions that allow the ability to drill down, roll up and drill across on event data
-
Summary reports run much faster with precomputed summaries
Aggregation Benefits:
-
Only processes active summaries
-
Does not affect event insertion into the real-time database.
Report Data Configuration tab allows you to:
-
Enable/disable any predefined summaries
-
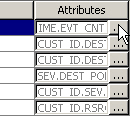
View attributes of each summary
-
See the validity of a summary for a period of time
-
Query which Event files need to be run so that the summary is complete
The following are all summaries already defined in the system.
Table 12-2 Summary Name Description
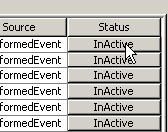
12.9.1 Disabling or Enabling a Summary
-
Click in the navigation pane or click the button.
-
To disable a summary, click in the Status column until it changes to say .
-
To enable a summary, click in the Status column until it changes to say .
12.9.2 Viewing Information for a Summary
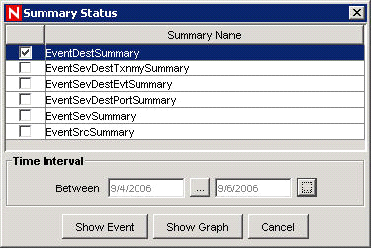
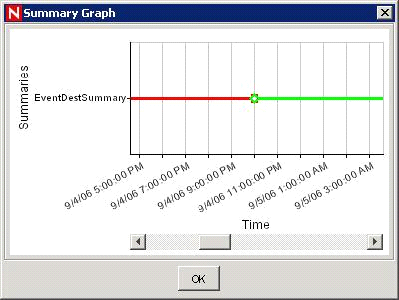
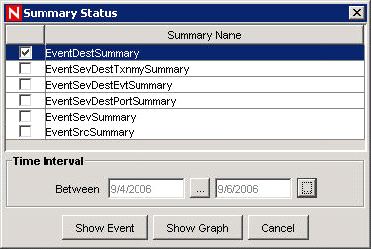
12.9.3 Checking the Validity of a Summary
-
Click in the navigation pane or click the button.
-
Select .
-
Select the summary or summaries you want to query.
-
Select a time interval.
-
Click .
The green bars signify that the summary is complete for that time frame. The red sections signify that the summary is missing data during that time period.
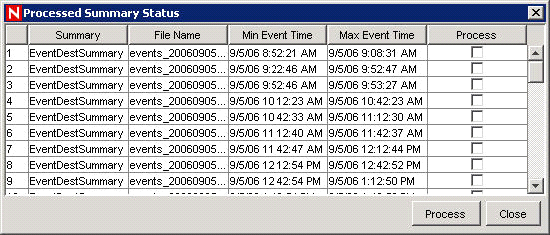
12.9.4 Query the Event Files for a Summary
-
Click in the navigation pane or click the button.
-
Select .
-
Select the summary or summaries you want to query.
-
Select a time interval.
-
Click .
-
The event files needed to complete the summary display in a list format.
To complete summaries, see Section 12.9.5, Running the Event Files for a Summary.
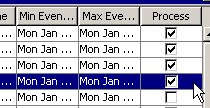
12.9.5 Running the Event Files for a Summary
-
Click in the navigation pane or click the button.
-
Select .
-
Select the summary or summaries you want to query.
-
Select a time interval.
-
Click .
The event files needed to complete the summary display in a list format.
-
Select the event files that you want to run so that the summary is complete.
-
Click .