A.4 Logical Architecture
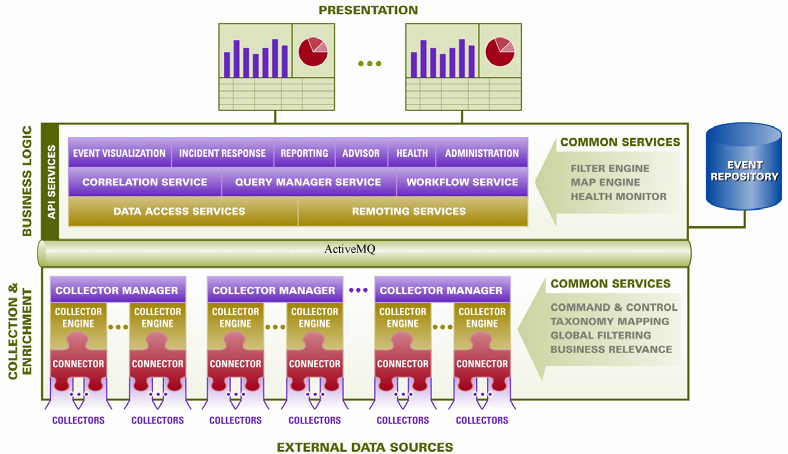
Sentinel is composed of three logical layers: the collection and enrichment layer, the business logic layer, and the presentation layer.
Figure A-10 Sentinel Logical Layers
-
The collection and enrichment layer aggregates the events from external data sources, transforms the device-specific formats into Sentinel format, enriches the native events source with business-relevant data, and dispatches the event packets to the message bus. The key component orchestrating this function is the Collector, aided by a taxonomy mapping and global filter service.
-
The business logic layer contains a set of distributable components. The base component is a Remoting service that adds messaging capabilities to the data objects and services to enable transparent data access across the entire network and Data Access service that is an object management service to allow users to define objects using metadata. Additional services include Correlation, Query Manager, Workflow, Event Visualization, Incident Response, Health, Advisor, Reporting, and Administration.
-
The presentation layer renders the application interface to the end user. A comprehensive dashboard called the Sentinel Control Center offers an integrated user workbench consisting of an array of seven different applications accessible through a single common framework. This cross-platform framework is built on Java 1.4 standards and provides a unified view into independent business logic components: real-time interactive graphs, actionable incident response, automated enforceable incident workflow, reporting, incident remediation against known exploits and more.
Each of the layers are illustrated in Figure A-10 and subsequently discussed in detail in the following sections.
A.4.1 Collection and Enrichment Layer
Event Source Management (ESM) provides tools to manage and monitor connections between Sentinel and third-party event sources. Events are aggregated by using a set of flexible and configurable Collectors, which collect data from a myriad of sensors and other devices and sources. User can use prebuilt Collectors, modify existing Collectors or build their own Collectors to ensure that the system meets all requirements.
Data aggregated by the Collectors in the form of events is subsequently normalized and transformed into XML format, enriched with a series of metadata (that is, data about data) using a set of business relevance services, and propagated to the server side for further computational analysis through the message bus platform. The collection and enrichment layer consists of the following components:
Connectors and Collectors
A Connector is a concentrator or multiplexed adapter that connects the Collector Engine to the actual monitored devices.
Collectors are the component-level aggregators of event data from a specific source. Sentinel primarily supports remote “Collector-less” connections to sources; however, Collectors can be deployed on specific devices where a remote approach is less efficient.
Collectors are controlled from the Sentinel Control Center, which orchestrates the communication between the Collectors and the Sentinel platform for real time analysis, correlation computation and incident response.
Collector Manager and Engine
Collector Manager manages the Collectors, monitors system status messages, and performs event filtering as needed. The main functions of the Collector Manager include transforming events, adding business relevance to events through taxonomy, performing global filtering on events, routing events, and sending health messages to the Sentinel server.
A Collector Engine is the interpreter component that parses the Collector code.
Collector Builder
The Collector Builder is a standalone application that is used to build, configure, and debug Collectors. This application serves as an integrated development environment that allows the user to create new Collectors to parse data from source devices, using a special-purpose interpretive language designed to handle the nature of network and security events.
ESM introduces a new hierarchy of deployment objects that allows users to group multiple connections into sets. The hierarchy is as follows:
Figure A-11 ESM Hierarchy
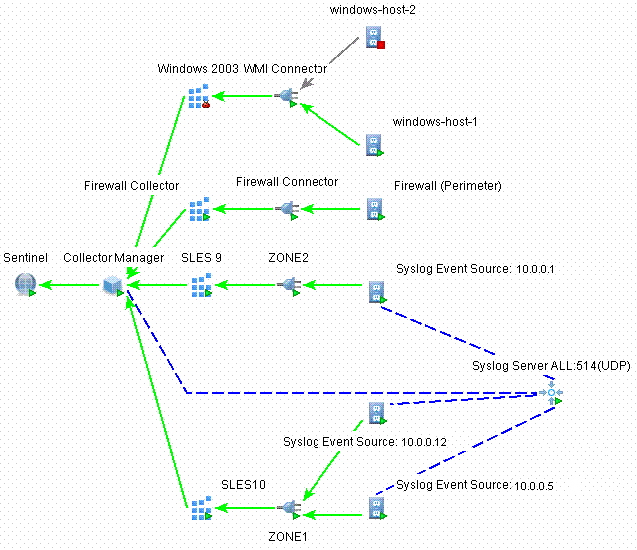
The event source, event source server, Collector, and Connector are configuration-related objects that can be added through the ESM user interface.
-
Event Source: This node represents a connection to a specific source of data, such as a specific file, firewall, or Syslog relay, and contains the configuration information necessary to establish the connection. The health of this node represents the health of the connection to the data source. This node sends raw data to its parent Connector node.
-
Event Source Server: This node represents a deployed instance of a server-type Connector plug-in. Some protocols, such as Syslog UDP/TCP, NAudit, and others, push their data from the source to a server that is listening to accept the data. The event source server node represents this server and can be configured to accept data from protocols that are supported by the selected Connector plug-in. This node redirects the raw data it receives to an event source node that is configured to receive data from it.
-
Collector: This node represents a deployed instance of a Collector script. It specifies which Collector script to use as well as the parameter values with which the Collector should run. This node sends Sentinel events to its parent Collector Manager node.
-
Connector: This node represents a deployed instance of a Connector plug-in. It includes the specification of which Connector plug-in to use as well as some configuration information, such as auto-discovery. This node sends raw data to its parent Collector node.
Common Services
All of the components in this Collection and Enrichment layer are driven by a set of common services. These utility services form the fabric of the data collection and data enrichment and assist in filtering the noise from the information (through global filters), applying user-defined tags to enrich the events information (through business relevance and taxonomy mapping services), and governing the data Collectors’ functions (through command and control services).
Taxonomy
Nearly all security products produce events in different formats and with varying content. For example, Windows and Solaris report a failed login differently.
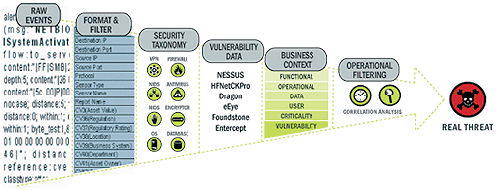
Sentinel’s taxonomy automatically translates heterogeneous product data into meaningful terms, which allows for a real-time homogeneous view of the entire network security. Sentinel taxonomy formats and filters raw security events before adding event context to the data stream. This process formats all the security data in the most optimal structure for processing by the Sentinel Correlation engine, as you can see in the following diagram.
Figure A-12 Sentinel Taxonomy
Business Relevance
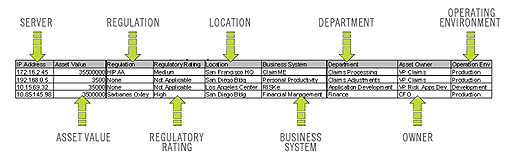
Sentinel injects business-relevant contextual data directly into the event stream. It includes up to 135 customizable fields where users can add asset specific information such as business unit, owner, asset value, and geography. After this information is added into the system, all other components can take advantage of the additional context.
Figure A-13 Injecting Business Relevance
Exploit Detection
Exploit Detection enables immediate, actionable notification of attacks on vulnerable systems. It provides a real-time link between intrusion detection system signatures and vulnerability scan results, notifying users automatically and immediately when an attack attempts to exploit a vulnerable system. This dramatically improves the efficiency and effectiveness of incident response.
Exploit Detection provides users with updates of mappings between intrusion detection systems and vulnerability scanner product signatures. The mappings include a comprehensive list of intrusion detection systems and vulnerability scanners. Users simply upload vulnerability scan results into Sentinel. Exploit Detection automatically parses them and updates the appropriate intrusion detection system Collectors. It uses the embedded knowledge of vulnerability status to efficiently and effectively prioritize responses to security threats in real time.
When an attack is launched against a vulnerable asset, Exploit Detection alerts users with the corresponding severity level of the exploited vulnerability. Users can then take immediate action on high-priority events. This takes the guesswork out of alert monitoring and increases incident response efficiency by focusing reaction on known attacks against vulnerable assets.
Exploit Detection also enables users to map or “un-map” signatures and vulnerabilities to tune out false positives and negatives and to leverage custom signatures or vulnerability scans.
A.4.2 Business Logic Layer
Sentinel services run in specialized containers and allow unparalleled processing and scaling because they are optimized for message-based transport and computation. The key services that make up the Sentinel server include:
Remoting Service
Sentinel’s Remoting Service provides the mechanism by which the server and client programs communicate. This mechanism is typically referred to as a distributed object application.
The Remoting Service provides the following capabilities:
-
Locating remote objects: This is achieved through metadata that describes the object name or registration token, although the actual location is not required, because the iSCALE message bus allows for location transparency.
-
Communicating with remote objects: Details of communication between remote objects are handled by the iSCALE message bus.
-
Object streaming and chunking: When large amounts of data need to pass back and forth from the client to the server, these objects are optimized to load the data on demand.
-
Callbacks: Another pattern and layer of abstraction built into the Remoting Service that allows for PTP remote object communication.
-
Service monitoring and statistics: Provides performance and load statistics for using these remote services.
Data Access Service
Data Access Service (DAS) is an object management service that allows users to define objects using metadata. DAS manages the object and access to objects and automates transmission and persistence. DAS also serves as a facade for accessing data from any persistent data store such as databases, directory services, or files. The operations of DAS include uniform data access through JDBC, and high-performance event insert strategies using native Connectors.
Query Manager Service
The Query Manager Service orchestrates drill-down and event history requests from the Sentinel Control Center. This service is an integral component for implementing the paging algorithm used in the Event History browsing capability. It converts user-defined filters into valid criteria and appends security criteria to it before events are retrieved. This service also ensures that the criteria do not change during a paged event history transaction.
Correlation Service
Sentinel’s correlation algorithm computes correlated events by analyzing the data stream in real time. It publishes the correlated events based on user-defined rules before the events reach the database. Rules in the correlation engine can detect a pattern in a single event of a running window of events. When a match is detected, the correlation engine generates a correlated event describing the found pattern and can create an incident or trigger a remediation workflow through ActiveMQ. The correlation engine works with a rules checker component that computes the correlation rule expressions and validates the syntax of filters. In addition to providing a comprehensive set of correlation rules, Sentinel’s correlation engine provides specific advantages over database-centric correlation engines.
-
By relying on in-memory processing rather than database inserts and reads, the correlation engine performs during high steady-state volumes as well as during event spikes when under attack, which is the time when correlation performance is most critical.
-
The correlation volume does not slow down other system components, so the user interface remains responsive, especially with high event volumes.
-
Organizations can deploy multiple correlation engines, each on its own server, without the need to replicate configurations or add databases. Independent scaling of components provides cost-effective scalability and performance.
-
The correlation engine can add events to incidents after an incident has been determined.
Users are encouraged to use a metric called Event Rules per Second (ERPS). ERPS is the measure of the number of events that can be examined by a correlation rule per second. This measure is a good performance indicator because it estimates the impact on performance when two factors intersect: events per second and number of rules in use.
Dynamic Lists
Dynamic lists are distributed list structures that can be used for storing elements and performing fast lookups on those elements. These lists can store a set of strings such as IP addresses, server names, or usernames. Examples of dynamic lists include:
-
Terminated user list
-
Suspicious user watch list
-
Privileged user watch list
-
Authorized ports and services list
-
Authorized server list
In all cases, correlation rules might reference named dynamic lists to perform lookups on list members. For example, a rule can be written to identify a file access event from a user who is not a member of the Authorized Users list. Additionally, correlation actions integrate with the dynamic list module to add or remove elements from a list. The combination of lookups and automated actions on the same list provides a powerful feedback mechanism used to identify complex situations.
Workflow Service (iTRAC)
The Workflow Service receives triggers on incident creation and initiates workflow processes based on predefined workflow templates. It manages the life cycle of these processes by generating work items or executing activities. This service also maintains a history of completed processes that can be used for auditing incident responses.
Event Visualization
Active Views, the interactive graphical user interface for event visualization, provides an integrated security management dashboard with a comprehensive set of real-time visualization and analytical tools to facilitate threat detection and analysis. Users can monitor events in real time and perform instant drill-downs from seconds to hours in the past. A wide array of visualization charts and aids allow monitoring of information through 3D bar, 2D stacked, line and ribbon chart representation and others. Additional valuable information can be viewed from the Active Views dashboard, including notification of asset exploits (exploit detection), viewing asset information, and graphical associations between pertinent source IPs and destination IPs.
Because Active Views uses the ActiveMQ architecture, analysts can quickly drill down for further analysis because Active Views provides direct access to the real-time memory-resident event data, which easily handles thousands of events per second without any performance degradation. Data is kept in memory and written to the database as needed (Active Views can store up to 8 hours of data in memory with typical event loads). This uninterrupted, performance-oriented real-time view is essential when under attack or in a steady state.
Figure A-14 Active Views
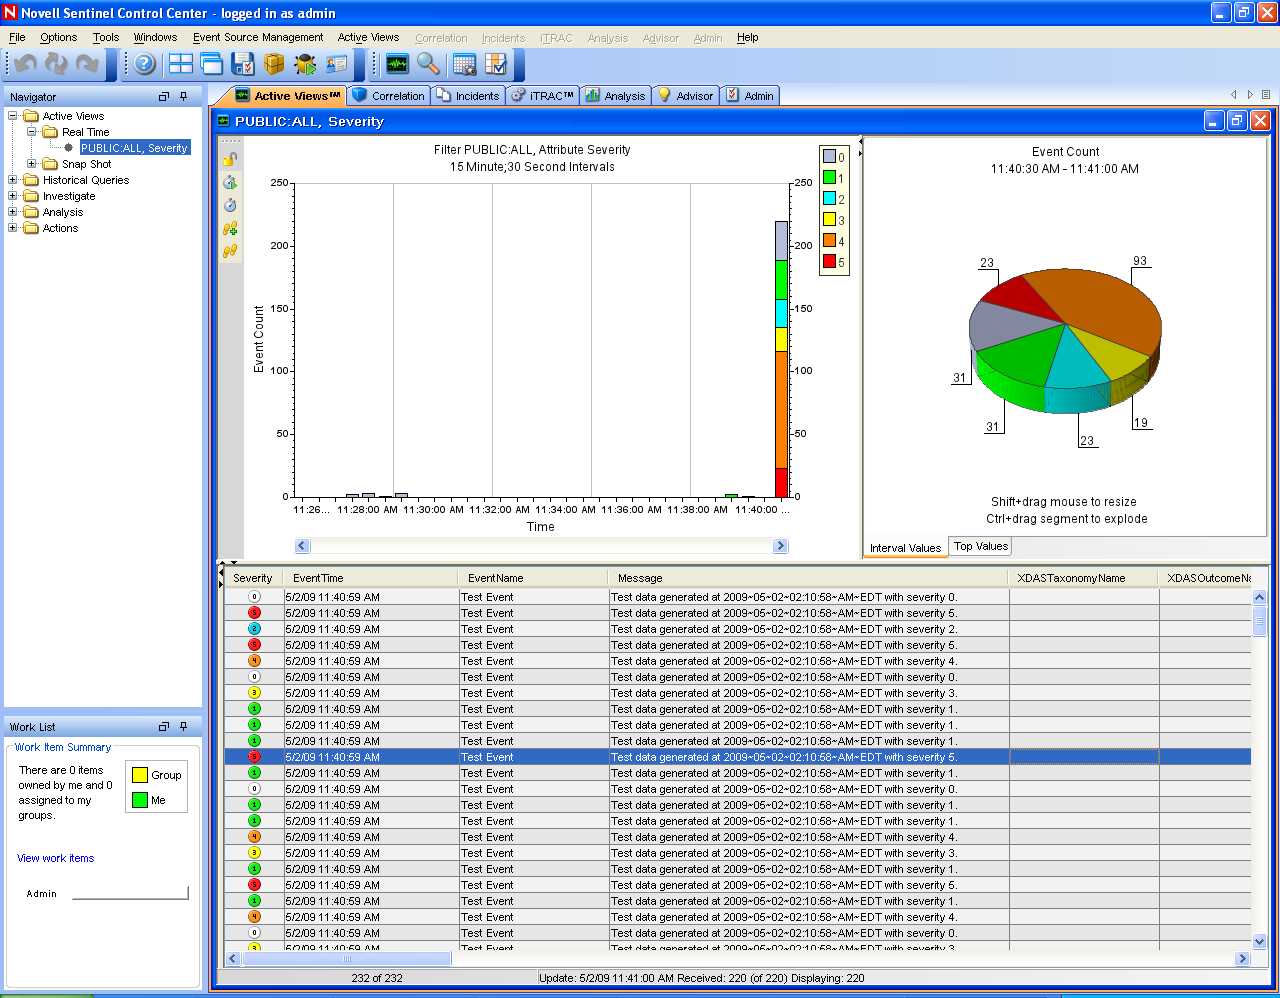
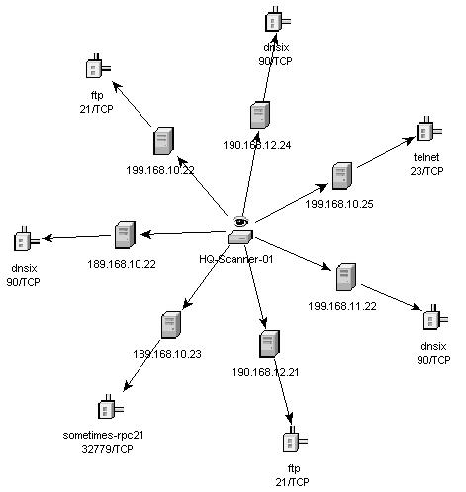
Figure A-15 Network
Incident Response Through iTRAC
Sentinel iTRAC transforms traditional security information management from a passive alerting and viewing role to an actionable incident response role by enabling organizations to define and to document incident resolution processes and then guide, enforce and track resolution processes after an incident or violation has been detected.
Sentinel comes with “out-of-the-box” process templates that use the SANS Institute’s guidelines for incident handling. Users can start with these predefined processes and configure specific activities to reflect their organization’s best practices. These processes can be automatically triggered from incident creation or correlation rules or manually engaged by an authorized security or audit professional. iTRAC keeps an audit trail of all actions to support compliance reporting and historical analysis.
Figure A-16 Process Template
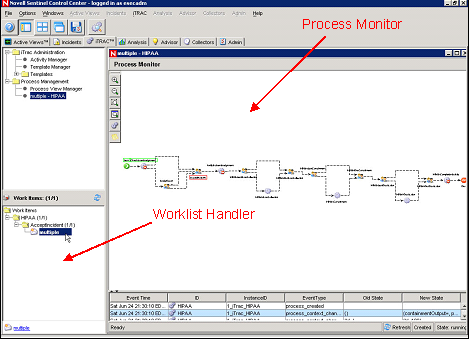
A worklist provides the user with all tasks that have been assigned to the user and a process monitor provides real-time visibility into process status during a resolution process life cycle.
iTRAC’s activity framework enables users to customize automated or manual tasks for specific incident-resolution processes. The iTRAC process templates can be configured by using the activity framework to match the template with an organization’s best practices. Activities are executed directly from the Sentinel Control Center.
iTRAC’s automation framework works using two key components:
-
s container: Automates the activity’s execution for the specified set of steps, based on input rules
-
Workflow container: Automates the workflow execution based on activities through a worklist.
The input rules are based on the XPDL (XML Processing Description Language) standard and provide a formal model for expressing executable processes in a business enterprise. This standards-based approach to the implementation of business-specific rules and rule sets ensures future-proofing of process definitions for customers.
The iTRAC system uses three Sentinel Rapid Deployment objects that can be defined outside this framework:
-
Incident: Incidents within Sentinel 6 are groups of events that represent an actionable security incident, associated state, and meta-information. Incidents are created manually or through correlation rules, and can be associated with a workflow process. They can be viewed on the tab.
-
Activity: An activity is a predefined automatic unit of work, with defined inputs, command-driven activity and outputs such as automatic attachment of asset data to the incident or generation of an e-mail. Activities can be used within workflow templates, triggered by a correlation rule, or executed by a right-click when viewing events.
-
Role: Users can be assigned to one or more roles, such as Analyst, Admin, and so on. Manual steps in the workflow processes can be assigned to a role.
Sentinel workflows have four major components that are unique to iTRAC:
-
Step: A step is an individual unit of work within a workflow; there are manual steps, decision steps, command steps, mail steps, and activity-based steps. Each step displays as an icon within a given workflow template.
-
Transition: A transition defines how the workflow moves from one state (activity) to another and can be determined by an analyst action, by the value of a variable, or by the amount of time elapsed.
-
Templates: A template is a design for a workflow that controls the execution of a process in Sentinel iTRAC. The template consists of a network of manual and automated steps, activities and criteria for transition between them. Workflow templates define how to respond to an incident when a process based on that template is instantiated. A template can be associated with many incidents.
-
Processes: A process is a specific instance of a workflow template that is actively being tracked by the workflow system. It includes all the relevant information relating to the instance, including the current step in the workflow, the associated incident, and the results of the steps, attachments and notes. Each workflow process is associated with one incident.
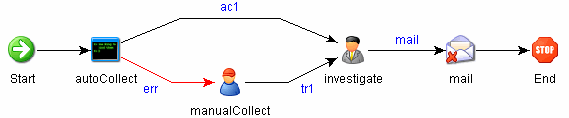
Figure A-17 iTRAC Workflow
Reporting Service
The Reporting service allows for reporting, including historical and vulnerability reports. Sentinel comes with out-of-the-box reports and enables users to configure their own reports using Jasper Reports. Some examples of reports included with Sentinel are:
-
Trend analysis
-
Security status of lines of business or critical assets
-
Attack types
-
Targeted assets
-
Response times and resolution
-
Policy compliance violations
Advisor
Sentinel Advisor cross-references Sentinel’s real-time alert data with known vulnerabilities and remediation information, bridging the gap between incident detection and response. With Advisor, organizations can determine if events exploit specific vulnerabilities and how these attacks impact their assets. Advisor also contains detailed information on the vulnerabilities that attacks intend to exploit, the potential effects of the attacks if successful and necessary steps for remediation. Recommended remediation steps are enforced and tracked by using iTRAC incident response processes.
Health
The Health service enables users to get a comprehensive view of the distributed Sentinel platform. It aggregates health information from various processes that are typically distributed on various servers. The health information is periodically displayed on the Sentinel Control Center for the end user.
Administration
The Administration facility allows for user management and settings facilities typically needed by application administrators of Sentinel.
Common Services
All of the components in this business logic layer of the architecture are driven by a set of common services. These utility services assist in fine-grained filtering (through the filter engine) of events to users, continuous monitoring of system health statistics (through the Health Monitor) and dynamic updates of system wide data (through the Map Service). Together, these utility services form the fabric of the loosely coupled services that allow for unparalleled processing and scaling over the message bus-based transport for real-time analytics and computation.
A.4.3 Presentation Layer
The presentation layer renders the application interface to the end user. The Sentinel Control Center, the Sentinel Rapid Deployment Web interface are the two comprehensive dashboards that present information to the user, and the Active Browser helps in viewing the selected events.
Sentinel Rapid Deployment Web Interface
With the Novell Sentinel Rapid Deployment Web interface, you can manage and search reports and launch the Sentinel Control Center (SCC), the Sentinel Data Manager (SDM), and the Solution Designer. You can also download the Collector Manager installer and the Client installer from the tab of the Sentinel Rapid Deployment Web interface.
The Web console used for Sentinel Rapid Deployment reporting and full text search also includes the option to launch and install the Sentinel client applications. You can now launch the Sentinel Control Center, Sentinel Solution Designer, and Sentinel Data Manager from a Web browser without installing these client applications locally. The Web console also includes the option to install the client applications and the Sentinel Collector Manager without manually retrieving the installation package.
Sentinel Control Center
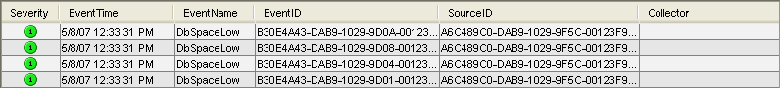
In the SCC interface, event presentation is possible through Active Views that display the events in a tabular form or by using different types of charts. The table format displays the variables of the events as columns in a table. Sorting information is possible by clicking on the column name in the grid.
Figure A-18 Active Views Tabular Format
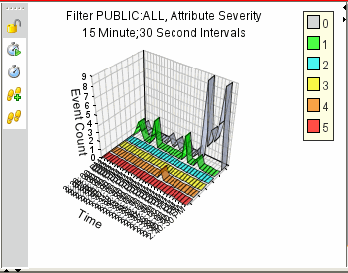
The graphical format displays events as graphs. Stacked Bar 2D, Bar, 3D, Line, and Ribbon graphs are available for representation of information.
Figure A-19 Active Views Graphical Format Stacked Bar 2D Graph
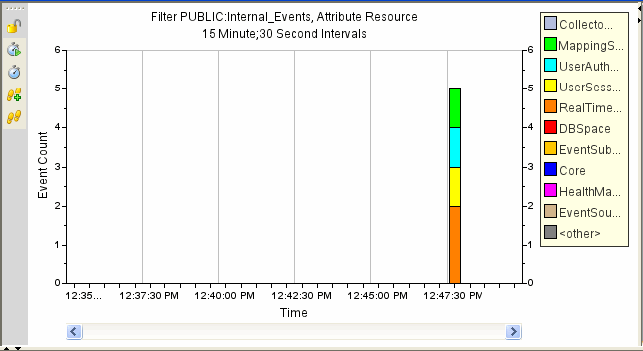
Figure A-20 Active Views Graphical Format Bar Graph
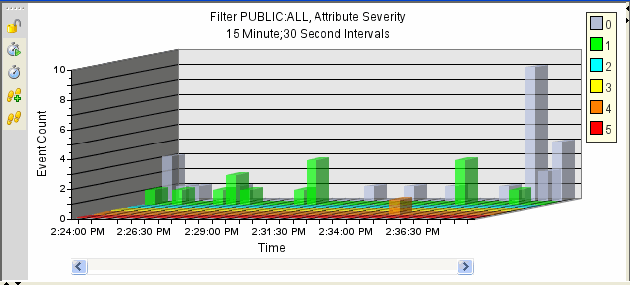
Figure A-21 Active Views Graphical Format Line Graph
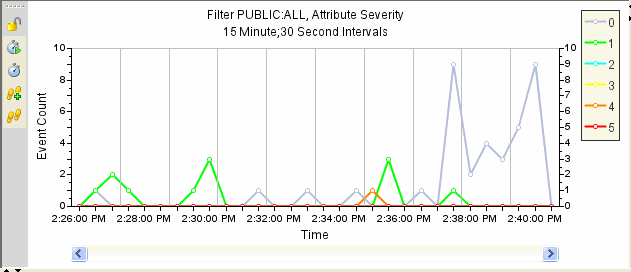
Figure A-22 Active View Graphical Format Ribbon Graph
Active Browser
The Active Browser facility helps in viewing the selected events. In the Active Browser, the events are grouped according to the meta tags. In these meta tags, various subcategories are defined. The numbers in the parentheses against these subcategories display the total number of event counts corresponding to the value of the meta tag.
Figure A-23 Active Browser
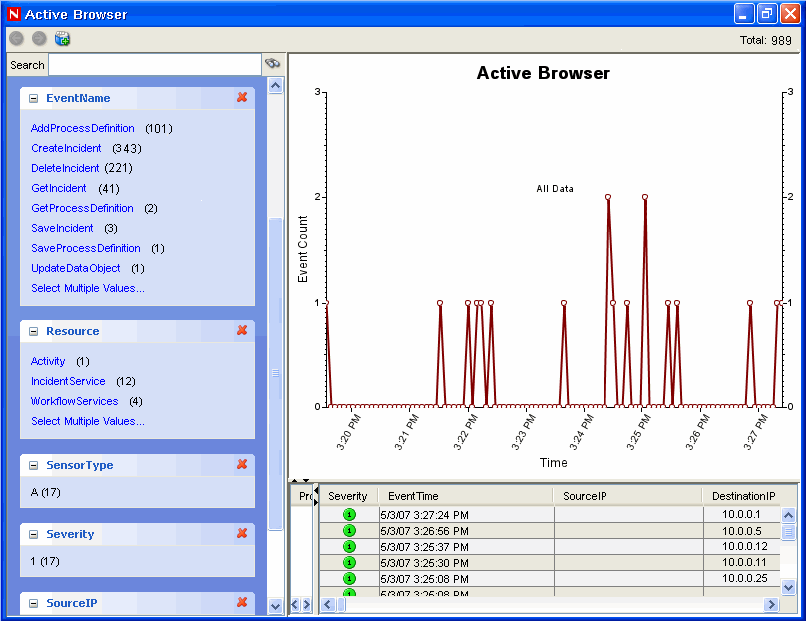
In the Active Browser, the query manager service retrieves a list of events taken from any part of the system and performs a statistical analysis of these events to break them down into ranges of values for each desired attribute of the event. Using single clicks through a Web browser interface, you can select ranges to quickly drill down on a large set of events. Individual event details can be viewed or exported to an HTML or CSV file. Additional event attributes for analysis can be added dynamically at any time, and the interface provides an interactive way to drill down on events in a given time range.