A.3 Architecture Overview
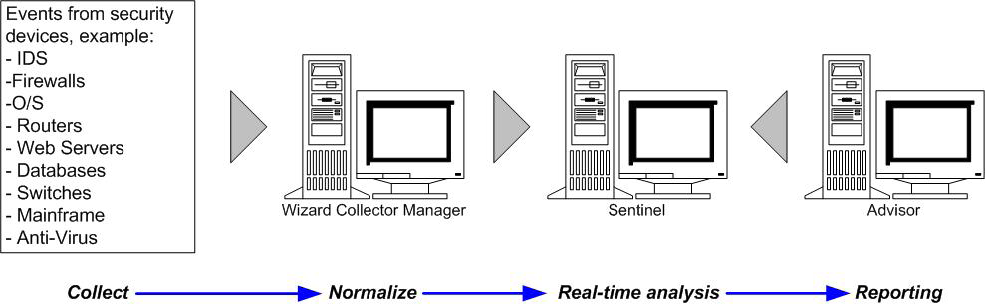
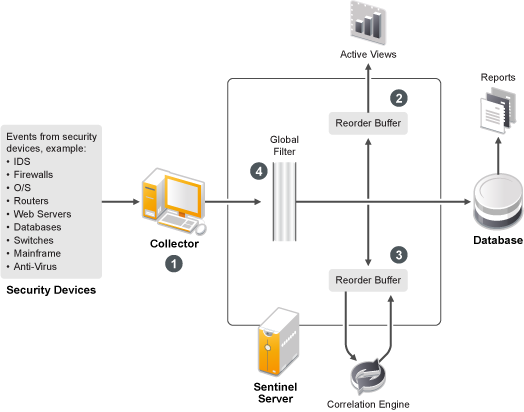
The Sentinel Rapid Deployment system is responsible for receiving events from the Collector Manager. The events are then displayed in real-time in an Active View and logged into a database for historical analysis.
At a high level, the Sentinel system uses a PostgreSQL database and is comprised of Sentinel processes and a reporting engine. The system accepts events from the Collector Manager as its input. The Collector Manager interfaces with third-party products and normalizes the data from these products. The normalized data is then sent to the Sentinel processes and database.
Historical analysis and reporting can be done by using the Sentinel integrated JasperReports reporting engine. The reporting engine extracts data from the database and integrates the report displays in the Web interface by using HTML documents over an HTTP connection.
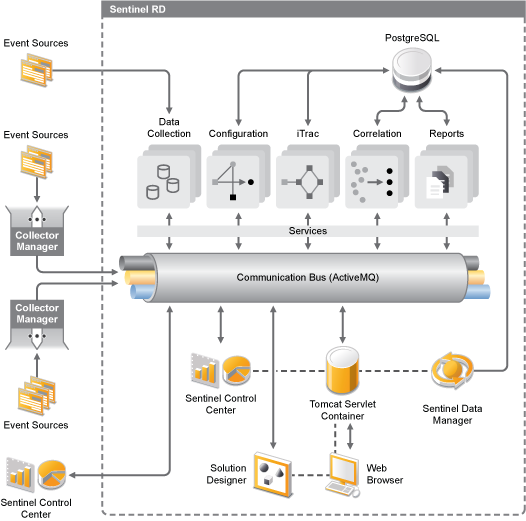
Figure A-1 Sentinel Architecture
A.3.1 Communication Server
Sentinel Rapid Deployment’s Apache ActiveMQ is an open source message broker. The architecture is built around the Java Message Oriented Middleware (JMOM), which supports asynchronous calls between the client and server applications. Message queues provide temporary storage when the destination program is busy or not connected. MOM reduces the complexity of the master-slave nature of the client/server mechanism.
ActiveMQ Message Bus
The ActiveMQ message bus allows for independent scaling of individual components while also allowing for standards-based integration with external applications. The key to scalability is that, unlike other distributed software, no two peer components communicate with each other directly. All components communicate through the message bus, which is capable of moving thousands of message packets per second.
Leveraging the unique features of the message bus, the high-throughput communication channel can maximize and sustain a high data throughput rate across the independent components of the system. Events are compressed and encrypted on the wire for secure and efficient delivery from the edge of the network or collection points to the hub of the system, where real-time analytics are performed.
The ActiveMQ message bus employs a variety of queuing services that improve the reliability of the communication beyond the security and performance aspects of the platform. Using a variety of transient and durable queues, the system offers unparalleled reliability and fault tolerance. For instance, important messages in transit are saved (by being queued) in case of a failure in the communication path. The queued message is delivered to the destination after the system recovers from the failure state.
Figure A-2 Message Bus
ActiveMQ takes advantage of an independent, multi-channel environment, which virtually eliminates contention and promotes parallel processing of events. These channels and sub channels work not only for event data transport but also offer fine-grained process control for scaling and load balancing the system under varying load conditions. Using independent service channels such as control channels and status channels, in addition to the main event channel, allows sophisticated and cost-effective scaling of event-driven architecture.
A.3.2 Sentinel Events
Sentinel receives information from devices, normalizes this information into a structure called a Sentinel event, and sends the event for processing. Events are processed by the real-time display, correlation engine, and the back-end server.
An event is made up of more than 200 tags. Tags are of different types and have different purposes. There are some predefined tags such as severity, criticality, destination IP, and destination port. There are two sets of configurable tags: reserved tags are for Novell internal use to allow future expansion and customer tags are for customer extensions.
Tags can be repurposed by renaming them. The source for a tag can either be external, which means that it is set explicitly by the device or the corresponding Collector, or referential. The value of a referential tag is computed as a function of one or more other tags using the mapping service. For example, a tag can be defined to be the building code for the building containing the asset mentioned as the destination IP of an event. Or, a tag can be computed by the mapping service by using a customer-defined map with the destination IP from the event.
Map Service
The Map Service allows a sophisticated mechanism to propagate business relevance data throughout the system. This facility aids scalability and provides an extensibility advantage by enabling intelligent data transfer between different nodes of the distributed system.
The Map Service cross-references vulnerability scanner data with intrusion detection system signatures and more (for example, asset data and business-relevant data). This allows immediate notification when an attack is attempting to exploit a vulnerable system. Three separate components provide this functionality:
-
Collection of real-time events from an intrusion detection source
-
Comparing those signatures to the latest vulnerability scans
-
Cross-referencing an attack feed through Sentinel Advisor (an optional product module, which cross-references between real-time intrusion detection system attack signatures and the user’s vulnerability scanner data).
The Map Service dynamically propagates information through out the system without impacting the system load. When important data sets (that is, “maps” such as asset information or patch update information) are updated in the system, the Map Service propagates the updates across the system.
Streaming Maps
The Map Service employs a dynamic update model and streams the maps from one point to another, avoiding the buildup of large static maps in dynamic memory. The value of this streaming capability is particularly relevant in a mission-critical real-time system such as Sentinel where there must be a steady, predictive, and agile movement of data independent of any transient load on the system.
Exploit Detection
Sentinel provides the ability to cross-reference event data signatures with vulnerability scanner data.You are notified automatically and immediately when an attack is attempting to exploit a vulnerable system. This is accomplished through:
-
The Advisor feed
-
Intrusion detection
-
Vulnerability scanning
-
The firewall
Advisor provides a cross-reference between event data signatures and vulnerability scanner data. The Advisor feed has both an alert feed and an attack feed. The alert feed contains information about vulnerabilities and threats. The attack feed is a normalization of event signatures and vulnerability plug-ins.
The supported systems are:
-
Intrusion Detections Systems
-
Cisco Secure IDS
-
Enterasys Dragon Host Sensor
-
Enterasys Dragon Network Sensor
-
Intrusion.com (SecureNet_Provider)
-
ISS BlackICE
-
ISS RealSecure Desktop
-
ISS RealSecure Network
-
ISS RealSecure Server
-
ISS RealSecure Guard
-
Snort
-
Symantec Network Security 4.0 (ManHunt)
-
Symantec Intruder Alert
-
McAfee IntruShield
-
-
Vulnerability Scanners
-
eEYE Retina
-
Foundstone Foundscan
-
ISS Database Scanner
-
ISS Internet Scanner
-
ISS System Scanner
-
ISS Wireless Scanner
-
Nessus
-
nCircle IP360
-
Qualys QualysGuard
-
You need at least one vulnerability scanner and either an intrusion detection system, IPS, or firewall from each category above. The intrusion detection system and Firewall DeviceName (rv31) must appear in the event as shown above. Also, the intrusion detection system and the firewall must properly populate the DeviceAttackName (rt1) field (for example, WEB-PHP Mambo uploadimage.php access).
The Advisor feed is sent to the database and then to the Exploit Detection Service. The Exploit Detection Service generates one or two files, depending upon what kind of data has been updated.
Figure A-3 Exploit Detection
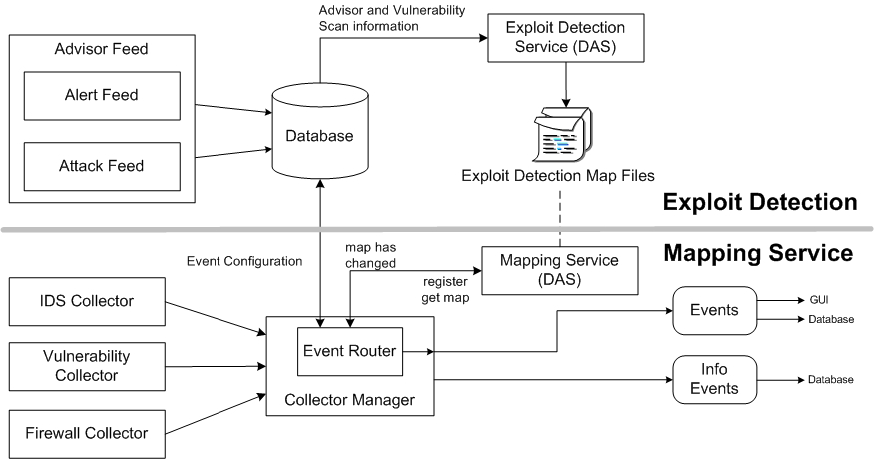
The Exploit Detection map files are used by the Mapping Service to map attacks to exploits of vulnerabilities.
Vulnerability scanners scan for system (asset) vulnerable areas. Intrusion detection systems detects attacks (if any) against these vulnerable areas. Firewalls detect if any traffic is against any of these vulnerable areas. If an attack is associated with any vulnerability, the asset has been exploited.
The Exploit Detection Service generates two files located in:
<install_directory>/bin/map_data
The two files are attackNormalization.csv and exploitDetection.csv.
The attackNormalization.csv is generated after:
-
Advisor feed
-
DAS Startup (if enabled in das_core.xml; disabled by default)
The exploitDetection.csv is generated after one of the following:
-
Advisor feed
-
Vulnerability scan
-
Sentinel server startup (if enabled in das_core.xml; disabled by default)
By default, there are two configured event columns used for exploit detection and they are referenced from a map (all mapped tags have the Scroll icon).
-
Vulnerability
-
AttackId
Figure A-4 Event Columns
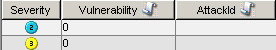
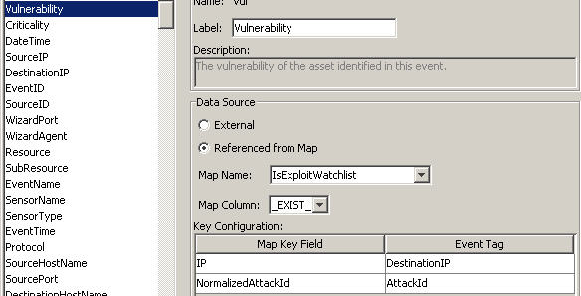
When the Vulnerability field (vul) equals 1, the asset or destination device is exploited. If the Vulnerability field equals 0, the asset or destination device is not exploited.
Sentinel comes preconfigured with the following map names associated with attackNormalization.csv and exploitDetection.csv.
Table A-2 Map Name and csv Filename
|
Map Name |
csv Filename |
|---|---|
|
AttackSignatureNormalization |
attackNormalization.csv |
|
IsExploitWatchlist |
exploitDetection.csv |
There are two types of data sources:
-
External: Retrieves information from the Collector
-
Referenced from Map: Retrieves information from a map file to populate the tag.
The AttackId tag has the Device (type of the security device, such as Snort) and AttackSignature columns set as Keys and uses the NormalizedAttackID column in the attackNormalization.csv file. In a row where the DeviceName event tag (an intrusion detection system device such as Snort, with information filled in by Advisor and Vulnerability information from the Sentinel database) is the same as Device and where the DeviceAttackName event tag (attack information filled in by Advisor information in the Sentinel Database through the Exploit Detection Service) is the same as AttackSignature, the value for AttackId is where that row intersects with the NormalizedAttackID column.
Figure A-5 AttackId and Data Source Information
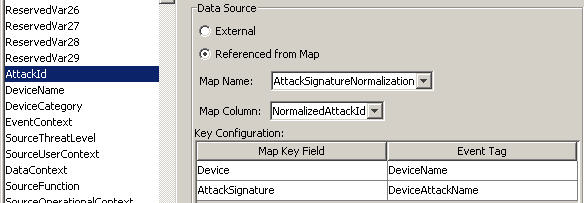
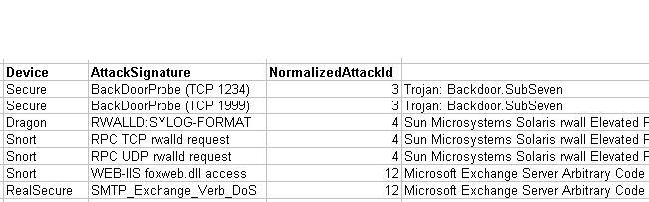
Figure A-6 attackNormalization.csv Sample
The Vulnerability tag has a column entry _EXIST_, which means that the map result value is 1 if the key is in IsExploitWatchlist (exploitDetection.csv file) or 0 if it is not. The key columns for the vulnerability tag are IP and NormalizedAttackId. When an incoming event with a DestinationIP event tag that matches the IP column entry and an AttackId event tag that matches the NormalizedAttackId column entry in the same row, the result is one (1). If no match is found in a common row, the result is zero (0).
Figure A-7 Vulnerability and Data Source
A.3.3 Event Source Management
Sentinel Rapid Deployment delivers a centralized event source management framework to facilitate data source integration. This framework enables all aspects of configuring, deploying, managing and monitoring data Collectors for a broad set of systems, which include databases, operating systems, directories, firewalls, intrusion detection/prevention systems, antivirus applications, mainframes, Web and application servers, and many more.
Using adaptable and flexible technology is central to Sentinel’s event source management strategy, which is achieved through interpretive Collectors that parse, normalize, filter and enrich the events in the data stream.
These Collectors can be modified as needed and are not tied to a specific environment. An integrated development environment allows for interactive creation of Collectors by using a “drag and drop” paradigm from a graphical user interface. Non-programmers can create Collectors, ensuring that both current and future requirements are met in an ever-changing IT environment. The command and control operation of Collectors (for example, starting, stopping, and so on) is performed centrally from the Sentinel Control Center. The event source management framework takes the data from the source system, performs the transformations, and presents the events for later analysis, visualization, and reporting purposes. The framework delivers the following components and benefits:
-
Collectors: Parse and normalize events from various systems.
-
Connectors: Connect to the data source to get raw data.
-
Taxonomy: Allows data from disparate sources to be categorized consistently.
-
Filtering: Eliminates irrelevant data at the point of collection, saving bandwidth and disk space.
-
Business relevance: Offers a way to enrich event data with valuable information.
-
Collector Builder: An integrated development environment for building custom Collectors to collect from unique or proprietary systems.
-
Live view: User interface for managing live event sources.
-
Scratch pad: User interface for offline design of event source configuration.
A.3.4 Application Integration
External application integration through standard APIs is central to Sentinel. For example, when dealing with a third party trouble-ticketing system, Sentinel 6 can open an initial ticket in its own iTRAC workflow remediation system. Sentinel then uses bidirectional API to communicate with the other trouble-ticketing systems, such as Remedy and HP OpenView’s ServiceDesk, allowing straightforward integration with external systems.
The API is Web Services-based and therefore allows any external systems that are SOAP-aware to take advantage of pervasive integration with the Sentinel system.
A.3.5 Time
The time of an event is very critical to its processing. It is important for reporting and auditing purposes as well as for real time processing. The correlation engine processes time-ordered streams of events and detects patterns within events as well as temporal patterns in the stream. However, the device generating the event might not know the real time when the event is generated. In order to accommodate this, Sentinel allows two options in processing alerts from security devices: trust the time the device reports and use that as the time of the event, or do not trust the device time and instead stamp the event at the time it is first processed by Sentinel by the Collector.
Sentinel is a distributed system and is made up of several processes that can be in different parts of the network. In addition, there can be some delay introduced by the device. In order to accommodate this, the Sentinel processes reorder the events into a time ordered stream before processing.
The following illustration explains the concept of Sentinel time.
Figure A-8 Time
-
By default, the event time is set to Collector Manager time. The ideal time is the device time. Therefore it is best to set the event time to the device time if the device time is available, accurate, and properly parsed by the Collector.
-
Events are sorted into 30 second buckets so that they can be viewed in Active Views. By default, the events that have a timestamp within a 5 minute range from the DAS Core server time (in the past or future) are processed normally. Events that have timestamps more than 5 minutes in the future do not show in the Active Views, but are inserted into the database. Events that have timestamps more than 5 minutes and less than 24 hours in the past are still shown in the charts, but are not shown in the event data for that chart. A drill down operation is necessary to retrieve those events from the database.
-
If the event time is more than 30 seconds older than the server time, the correlation engine does not process the events.
-
If the event time is older than 5 minutes than the Collector Manager time (correct time), events are directly routed to the database.
A.3.6 System Events
System events are a means to report on the status and status changes of the system. There are three types of events generated by the internal system:
Internal Events
Internal events are informational and describe a single state or change of state in the system. They report when a user logs in or fails to authenticate, when a process is started, or when a correlation rule is activated.
Performance Events
Performance events are generated on a periodic basis and describe average resources used by different parts of the system.
Audit Events
Audit events are generated internally. Each time an audited method is called or an audited data object is modified, the audit framework generates audit events. There are two types of Audit events: one that monitors user actions such as user login/out, add/delete user and another that monitors system actions and health, such as process start/stop.
Some of these events were formerly called internal events (mainly for system actions/health monitoring), so the functionality of Audit events is similar to internal events. Audit events can be logged into log files, saved into database, and sent out as Audit events simultaneously (internal events are only sent out as events.).
All System events populate the following attributes:
-
Sensor Type (ST) field: For internal events this field is set to I, for Audit events it is set to A, and for performance events it is set to P.
-
Event ID: A unique UUID for the event.
-
Event Time: The time the event was generated.
-
Source: The UUID of the process that generated the event.
-
Sensor Name: The name of the process that generated the event (for example, DAS_Binary).
-
RV32 (Device Category): Set to .ESEC.
-
Collector: .Performance. for performance events, Audit for Audit events, and Internal for internal events.
In addition to the common attributes, every system event also sets the resource, sub-resource, the severity, the event name, and the message tags. For internal events, the event name should be specific enough to identify the exact meaning of the event (for example, UserAuthenticationFailed). The message tags add some specific detail; for UserAuthenticationFailed, the message tag contains the name of the user, the OS name if available, and the machine name). For performance events the event name is generic, describing the type of statistical data and the data itself is in the message tag.
Performance events are sent directly to the database. To view them, do a quick query.
For more information, see Section B.0, System Events for Sentinel.
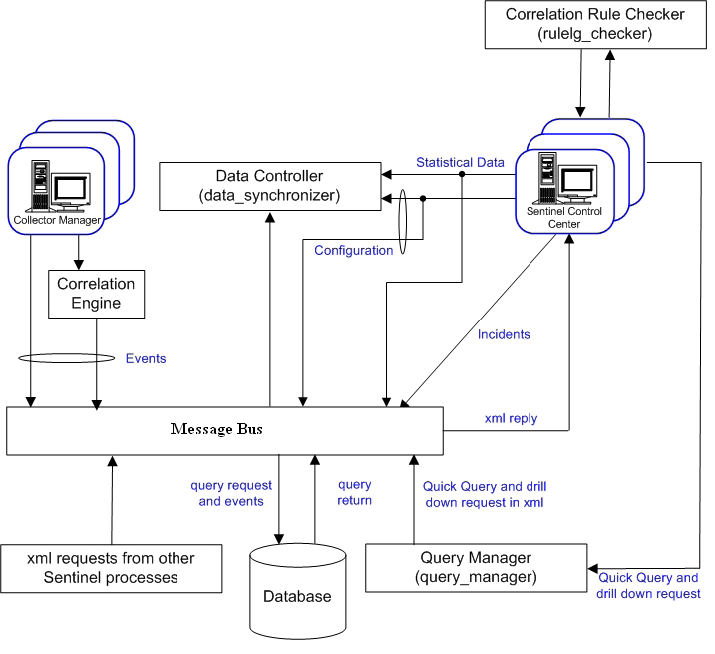
A.3.7 Processes
The following processes and the services communicate with each other through the ActiveMQ message bus.
The following illustration shows the architecture for the Sentinel server.
Figure A-9 Sentinel Server Architecture
Sentinel Service (Watchdog)
Watchdog is a Sentinel process that manages other Sentinel processes. If a process other than Watchdog stops, Watchdog reports this and then restarts that process.
If this service is stopped, it stops all Sentinel processes on that machine. It executes and reports the health of other Sentinel processes. This process is launched by the Sentinel service.
Data Access Service (DAS) Process
The Data Access Service (DAS) is Sentinel server's persistence service and provides an interface to the database. It provides data-driven access to the database back-end.
DAS is a container composed of two different processes. Each process is responsible for different types of database operations.
-
DAS Core: DAS core container, which performs the following functions:
-
General Sentinel Service operations including login and historical queries.
-
Provides the server-side functionality for Active Views.
-
Calculates event data summaries that are used in reports.
-
Provides the server-side functionality for Sentinel iTRAC.
-
Provides the server side of the SSL proxy connection to Sentinel server.
-
-
DAS Binary: Performs event database insertion.
These processes are controlled by the following configuration files:
-
das_binary.xml: Used for event and correlated event insertion operations
-
das_core.xml: All other database operations
DAS receives requests from the different Sentinel processes, converts them to a query against the database, processes the result from the database, and converts it back to a reply. It supports requests to retrieve events for Quick Query and Event Drill Down, in order to retrieve vulnerability information and advisor information and to manipulate configuration information. DAS also handles logging of all events being received from the Collector Manager and requests to retrieve and store configuration information.
Correlation Engine Process (correlation_engine)
The correlation engine (correlation_engine) process receives events from the Collector Manager and publishes correlated events based on user-defined correlation rules.
Collector Manager
The Collector Manager services, processes, and sends events.
ActiveMQ
An open source communication server built around the message-oriented middleware (MOM) architecture. It provides the communication platform for all other Sentinel processes.