17.5 Configuring Sentinel Systems for Receiving Events
On the receiver system, you must configure the Sentinel Link Collector, which generates events from the data received by the Sentinel Link Connector. You must also configure the Sentinel Link Connector and configure a Sentinel Link Event Source Server to receive the event data from the sender systems.
17.5.1 Accessing Event Source Management
Sentinel
-
As the Sentinel Administrator User (esecadm), change the directory to:
$ESEC_HOME/bin
-
Run the following command:
control_center.sh
-
Specify the administrator username and password, then click .
-
In the Sentinel Control Center, select .
Sentinel Rapid Deployment
-
Open a Web browser to the following URL:
https://svrname.example.com: port/sentinel
Replace svrname.example.com with the actual DNS name or IP address (such as 192.168.1.1) of the server where Novell Rapid Deployment is running.
-
If you are prompted to verify the certificates, review the certificate information, then click if it is valid.
-
Specify the username and password for the Sentinel Rapid Deployment account you want to access.
-
Use the drop-down list to specify which language you want to use.
-
Click .
-
In the Web interface, select from the left panel.
-
In the Application page, click to open the Sentinel Control Center.
-
Log in to the Sentinel Control Center as administrator.
-
Select .
Sentinel Log Manager
-
Open a Web browser to the following URL:
https://svrname.example.com: port/novelllogmanagerReplace svrname.example.com with the actual DNS name or IP address (such as 192.168.1.1) of the server where Novell Log Manager is running.
-
If you are prompted to verify the certificates, review the certificate information, then click if it is valid.
-
Specify the username and password for the Log Manager account you want to access.
-
Use the drop-down list to specify which language you want to use.
-
Click .
-
In the Novell Log Manager Web interface, click .
-
In the Collection page, click .
-
In the Advanced page, click to open the Event Source Management.
17.5.2 Setting Up a Sentinel Link Connection
This section describes how to set up the Sentinel Link connection to receive messages from another Sentinel or Sentinel Log Management system, and enable the messages to be processed by a Collector. To set up the Sentinel Link connection, you must, at a minimum, create and configure a Sentinel Link Event Source server. The Sentinel Link Event Source server automatically creates and configures the Connector, the Collector and the Event Source nodes as needed. You can also manually create the Collector, the Connector, and the Event Source nodes. However, it is easier and simpler to allow the Sentinel Link Event Source server auto-create them.
The instructions given in this section use the right-click menu items on the Event Source Management Graph View. However, all the steps described in this section can also be performed through the Event Source Management Table view and the option on the tool bar.
NOTE:These instructions assume that you have already downloaded and installed the Collector to process event data from the Sentinel Link Connector.
Configuring Sentinel Link Event Source Server
Configure a Sentinel Link Event Source server to set up a Sentinel Link connection to start processing the data received from the sender system. After you add a Sentinel Link Event Source server, the required Collector, the Connector, and the Event Source nodes are automatically created and configured when the server receives the events from the sender system. Allowing the Sentinel Link Event Source server to auto-create the nodes is much simpler and is preferred over manual configuration because it ensures that nodes are properly configured and connected so that events are routed to the Sentinel Link Collector.
-
In the Event Source Management view, right-click the Collector Manager, select , then select and click .
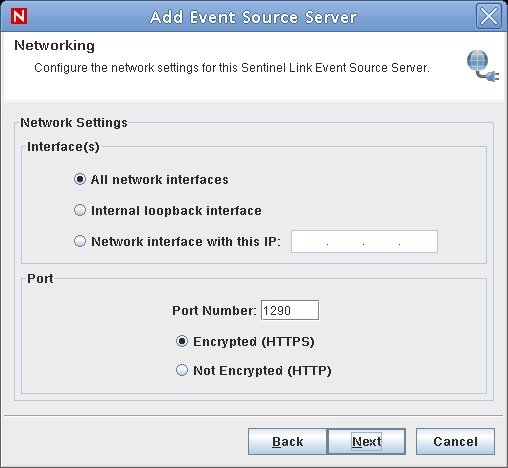
The Networking window is displayed.
-
Specify the following, then click .
-
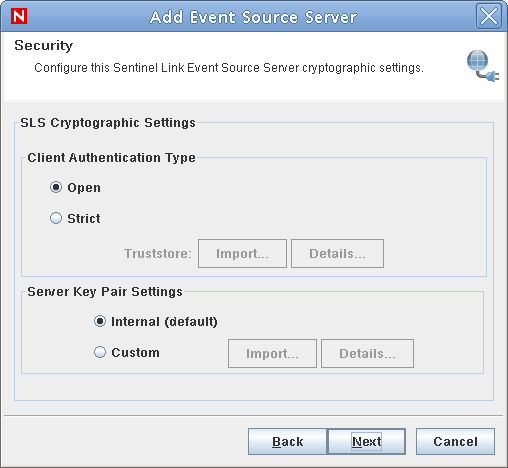
In the Security window for configuring authentication settings on the HTTPS port, specify the following:
-
Click .
The Auto Configuration window is displayed.
In this window, you can create policies to automatically add or exclude individual Sentinel source machines. You can select IP addresses, ranges or subnets to be auto-configured, auto-configured and started, or ignored by the Connector.
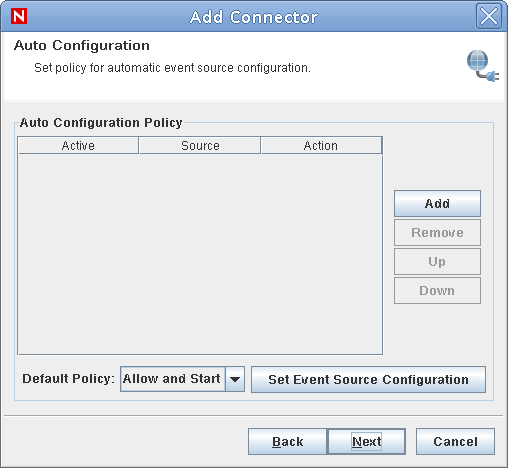
The Sentinel Link Event Source Server simplifies Event Source configuration with the option to detect a new source device that is sending data to the Sentinel Link Event Source Server, evaluate its IP address by using a set of user-defined policies, and either ignore the new source device or automatically add it as an Event Source in Event Source Management.
-
Click if you want to create a new policy.
-
Double-click the field and enter a source IP address or a range of IP addresses in one of the following formats:
-
Specific IP address (such as 10.0.0.1)
-
IP address range (such as 10.0.0.1-10.0.0.25)
-
IP address with mask (like 10.0.0.1/16)
-
-
Select an action to associate with the IP address or range of IP addresses:
-
The action creates and starts Event Source node in the ESM view.
-
The action auto-creates the Event Source node in the ESM view but does not auto- start the Event Source.
After the new Event Source node is created, an administrator can review and start it at any time.
-
The action prevents the auto-creation of an Event Source.
-
-
Select to activate the policy.
If there are multiple policies, reorder the order in which they are evaluated by using the and buttons.
-
Set the Default Policy, which applies to all sources that do not meet any of the criteria defined by the policies above.
-
To set the filtering and configuration settings for all automatically-created Event Sources, click the button. For more information on these options, see Adding Event Sources.
HINT:Auto-configured Event Sources should not be manually deleted in the Event Source Management interface because they are auto-configured again when the Connector restarts. To block a particular source device, add a Deny policy in Auto Configuration.
-
Click to display the General properties window.
-
Select to run the Sentinel Link Server automatically whenever the Collector Manager is restarted.
-
Click to complete the configuration of the Sentinel Link Event Source Server.
Manually Setting Up the Sentinel Link Connection
Although the Event Source server is capable of auto-creating the required Collector, Connector, and Event Source nodes, you might also want to manually create the Collector, the Connector, and the Event Source nodes.
Regardless of which way you choose, you must configure an Event Source server. For more information, see Configuring Sentinel Link Event Source Server. This section assumes that you have already configured an Event Source server.
NOTE:If you have not created an Event Source server, you are given the option to do so during the configuration of Connector nodes.
Adding a Collector
-
In the Event Source Management (Live View), right-click the Collector Manager node, then select .
-
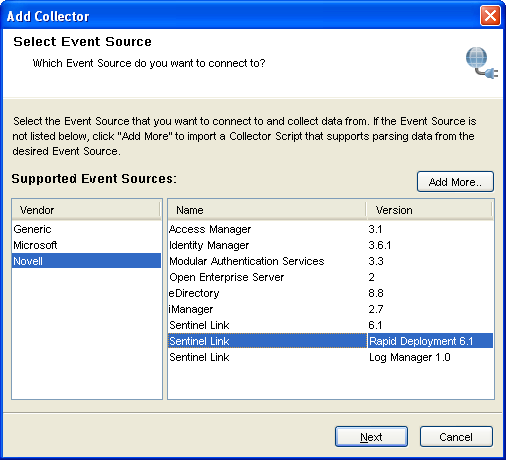
Select from the list of vendors from the left panel, then select the desired Sentinel Link version from the list of supported event sources, and click .
-
Select the Novell Sentinel Link Collector, then click .
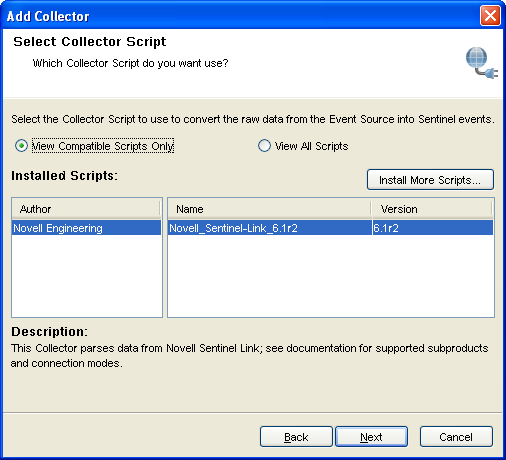
-
Click to accept the default Collector properties.
For more information on Collector properties, see the Sentinel Link Collector documentation.
-
Accept the default Collector configuration, then click to complete the configuration.
-
Continue with Adding a Connector.
Adding a Connector
In addition to the typical Collector Manager > Collector > Connector > Event Source hierarchy, the Sentinel Link Connector also requires a Sentinel Link Event Source Server.
-
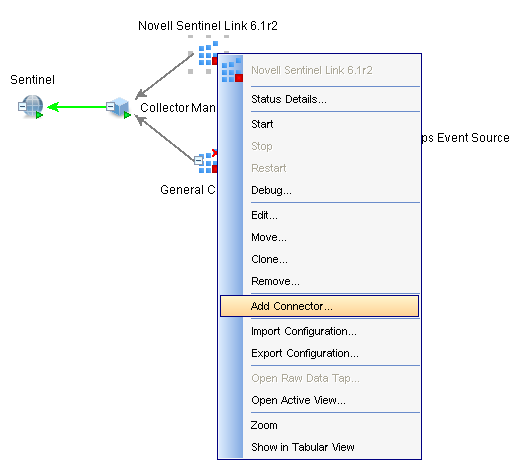
In the Event Source Management (Live View), right-click the Collector node that should process the data retrieved from the Sentinel Link Connector, then select .
-
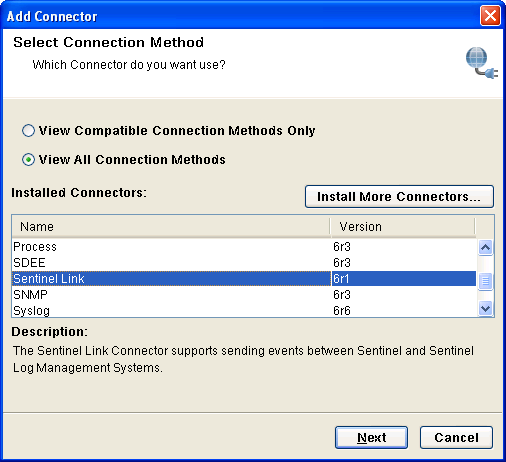
In the Select Connection Method window, select from the list of plug-ins, then click .
-
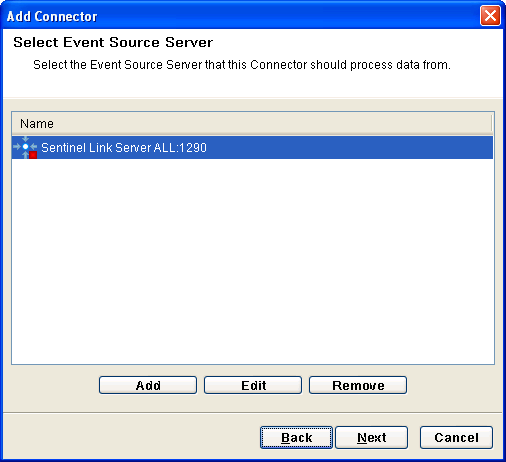
In the Select Event Source Server window, select the Event Source Server from the list of configured Event Source Servers.
If no Event Source Servers are configured, the following message displays:
There are no Event Source Servers configured on this Collector Manager that match the connection method selected. Please add an Event Source Server with a matching connection method or choose a different connection method.
-
Click , then create an Event Source Server. For more information on creating an Event Source server, see Step 2 through Step 13 in the Configuring Sentinel Link Event Source Server.
-
Click to open the Configure Connector window.
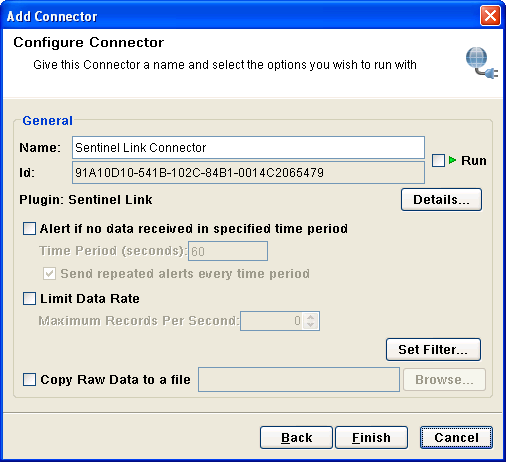
-
In the Configure Connector window, specify the following:
-
Click to confirm adding the Connector to the Event Source Management view.
Adding Event Sources
Sentinel Link Event Sources can be automatically detected and added according to user-configured rules, or they can be added manually.
-
In Event Source Management, right-click the Sentinel Link Connector, then select .
The Client IP Address window displays.
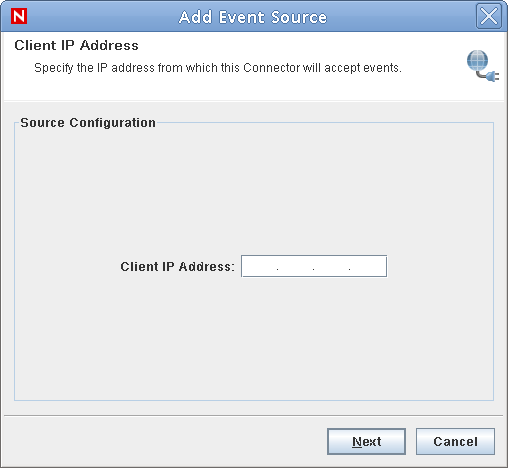
-
Specify the IP address of the sender machine, which the Sentinel Link event source receives the messages from.
-
Click .
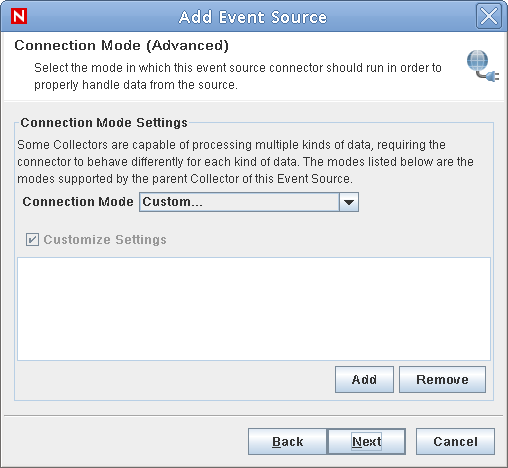
The Connection Mode (Advanced) window displays and shows all preset connection modes that are supported by the Collector. Each connection mode sends the data in a different format. For the Novell Collectors, which support more than one connection mode for different data formats, see the Collector-specific documentation for information about which mode is appropriate for your particular Event Source.
-
Select a Connection Mode.
-
Click . The General window displays.
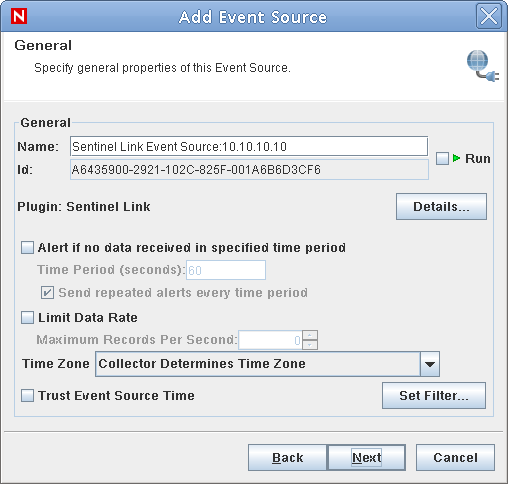
-
Specify the General settings for the Sentinel Link Connector:
-
Click .
The Summary window is displayed.
-
To test the configuration, click .
NOTE:The Sentinel Link Event Source Server and Connector must be running to list the messages in the Test Connection window.
The Test Connection window is displayed with and tabs.
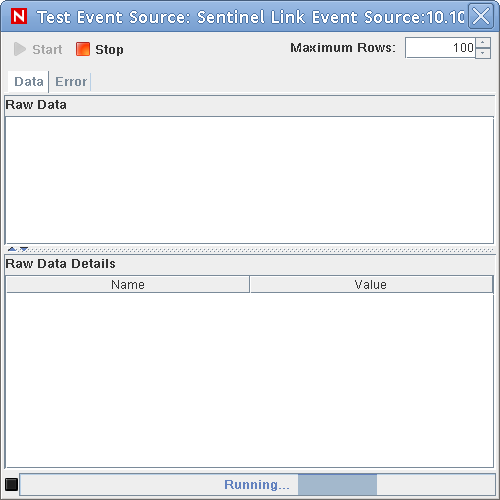
-
On the tab, specify the maximum number of rows of data to be displayed in the Test Connection window at one time.
-
Click to start the connection test.
The tab displays the events generated on successful connection with the Event Source.
If there are errors, click the r tab to display any errors in the event source configuration.
-
Click the button to stop the connection test.
-
Close the Test Connection window.
-
-
Click to add the Event Source to the Event Source Management view.