4.1 Testing the Installation
Sentinel is installed with a demonstration collector that can be used to test many of the basic functions of the system. Using this collector, you can test Active Views, Incident creation, Correlation rules, and Reports. The following procedure describes the steps to test the system and the expected results. You might not see the exact events, but your results should be similar to the results below.
At a basic level, these tests allow you to confirm the following:
-
Sentinel Services are up and running
-
Communication over the message bus is functional
-
Internal audit events are being sent
-
Events can be sent from a Collector Manager
-
Events are being inserted into the database and can be retrieved using either Historical Event Query or the Crystal Reports
-
Incidents can be created and viewed
-
The Correlation Engine is evaluating rules and triggering correlated events
-
The Sentinel Data Manager can connect to the database and read partition information
If any of these tests fail, review the installation log and other log files, and contact Novell Technical Support, if necessary.
To test the installation:
-
Start the Sentinel Control Center:
-
Windows: Double-click the Sentinel Control Center icon on the desktop.
-
Linux/Solaris: Log in as an admin user (esecadm), change the directory to $ESEC_HOME/bin and run ./control_center.sh from the command prompt. Specify the credentials and press Enter.
-
-
Log in to the system as an admin user (esecadm by default).
The Sentinel Control Center opens and you can see the events in the Active Views filtered by public filters: Internal_Events and High_Severity.
-
Click the menu, and select .
-
In the Graphical view, right-click 5 eps event source and select .
-
Close the window.
-
Click the tab.
The Active window titled PUBLIC: High_Severity, Severity. The collector might take some time to start and send the data to get displayed in the Active View window.
-
Click the button in the toolbar.
The window is displayed.
-
In the window, click the drop-down arrow to select the filter. Highlight Public: All filter and click Select.
-
Select a time period that covers the time that the Collector has been active. Select the date range from the and drop-down list.
-
Select a batch size from the Batch size drop-down list.
-
Click the icon to run the query.
-
Hold down the Ctrl or Shift key, and select multiple events from the window.
-
Right-click and select .
-
Enter a name for the incident TestIncident1 and click . A success notification displays.
-
Click .
-
Click the tab.
The window is displayed that lists the incident that you created.
-
Double-click the incident to display.
-
Click > or click the button on the upper right corner of the window to close the window.
-
Click the tab.
The window with the Events folder is displayed.
-
Click .
-
Click > or click the icon.
An Event Query window is displayed. Set the following:
-
time frame
-
filter
-
severity level
-
batch size (this is the number of events to view – events display from oldest events to newer events)
-
-
Click the icon.
-
To view the next batch of events, click .
-
Rearrange the columns by dragging and dropping them, and sort the events as required by clicking the respective column heading.
When the query is complete, it gets added to the list of quick queries in the Navigator.
-
Click the tab.
The window is displayed.
-
Click .
The wizard is displayed.
-
Click .
The window is displayed.
-
Use the drop-down menus to set the criteria to Severity 4. Click .
The window is displayed.
-
Select and set the time period to 1 Minute using the drop-down menu. Click .
The window displays.
-
Enter a name and description for the rule, and click .
-
Select and click .
-
Create an action to associate the rule that you have created:
-
Perform either of the following:
The Configure Action window is displayed.
-
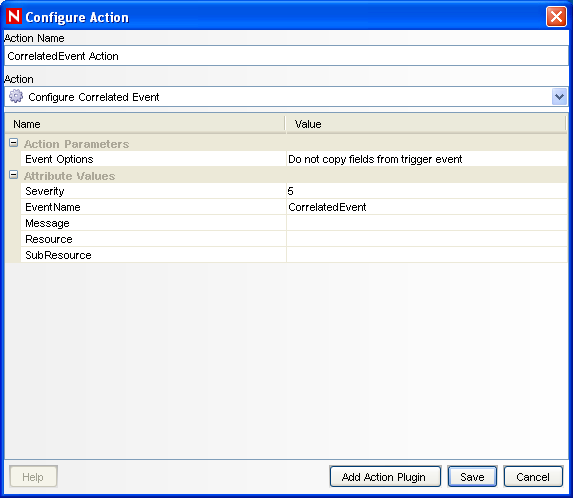
In the Configure Action window, specify the following:
-
Specify the action name. For example, CorrelatedEvent Action.
-
Select from the drop-down list.
-
Set the .
-
Set the to 5.
-
Specify the . For example, CorrelatedEvent.
-
Specify a message if required.
-
-
Click .
-
-
Open the Correlation Rule Manager window.
-
Select a rule and click the link.
The Deploy Rule window is displayed.
-
In the Deploy rule window, select the Engine to deploy the rule from the drop-down list.
-
Select the action that you created in Step 32 to associate with the rule and click .
-
Select .
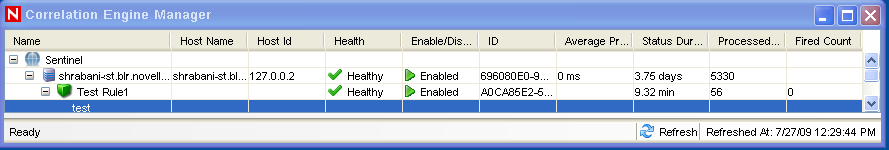
In the Correlation engine, you can see the rule is deployed/enabled.
-
Click the tab and verify that the Correlated Event is generated.

-
Close the Sentinel Control Center.
-
Double-click the Sentinel Data Manager (SDM) icon on the desktop.
-
Log in to SDM using the Database Administrative User specified during installation (esecdba by default).
-
Click each tab to verify that you can access them.
-
Close Sentinel Data Manager.
If you were able to proceed through all of these steps without errors, you have completed a basic verification of the Sentinel system installation.