2.2 Viewing Events in Active Views
Sentinel displays events in near real-time in Active Views tab in the Sentinel Control Center. As you view events, you can also perform relevant operations on the events, including:
-
Create incidents or add the events to an exiting incident
-
For correlated events, you can view the events that triggered the correlated event
-
Execute actions on the events
-
View the Advisor and asset data
For more information, see Section 2.2.4, Managing Events.
NOTE:You must have the Create and use Active Views permission to view and manage events in Active Views.
2.2.1 Accessing the Active Views Tab
When you launch the Sentinel Control Center, the Active Views tab is the first tab that is displayed. If the Active Views tab is not displayed, you can access it by:
-
Log in to the Sentinel Web interface, then click Applications in the toolbar.
-
Click Launch Control Center.
-
Log in to the Sentinel Control Center as a user with Create and use Active Views permission.
The Active Views tab is displayed.
Active Views provides two types of views, which display the events in tables and graphs.
Table format displays the variables of the events as columns in a table. You can sort the information in the grid by clicking the column name.
Graphical format displays events as graphs. You can change the chart types by right-clicking anywhere in the chart and by selecting the desired chart type. You can also view the events that match the filter criteria by right-clicking anywhere in the chart and by selecting the Drill-down option from the menu. The events are displayed in the Sentinel Web interface.
The event table and the snapshot are the two types of Active Views.
Near Real Time Event Table: Displays the events in graphs with the following features:
-
Holds up to 750 events per 30-second period. If there are more than 750 events, the events are prioritized to display correlated events first, then events that are sent to the GUI by using routing rules, then all remaining events.
-
By default, the client maintains a 24-hour period of cached events. You can configure the time. For more information, see Section 2.2.2, Reconfiguring Total Display Time.
-
By default, the smallest possible display interval of an active view is 30 seconds. This is represented by a gray line in the event table.
Figure 2-1 Gray Line- Indicating the Smallest Possible Display Interval

If there are more than 750 events per 30-second time period, a red separation line indicates that there are more events than are displayed.
Figure 2-2 Red Line- Indicating More Events to Display

-
When you save user preferences, the system continues to collect data for four days. For instance, if you save your preferences, then log out and log back in the following day, your Active View displays data as if you never logged off.
-
If an Active View is created and not saved, it continues to collect data for an hour. Within that hour, if an identical Active View is created, the Active View displays data for the last hour.
Snapshot: Time-stamped view of a Real Event View table.
Several features make an Active View unique.
-
The filter assigned to an Active View
-
The z-axis attribute
-
The security filter assigned to a user
You can change event names to user-friendly names and the new names are populated throughout the system. For more information, see Renaming Event Fields
in the NetIQ Sentinel Administration Guide.
2.2.4 Managing Events
In the table view, you can manage one or more events. Select the event or events you want to manage, then right-click and select the option.
Showing and Hiding Event Details
To show details in a Real Time Event Table of the Navigator or Snapshot, double-click or right-click an event, then click Show Details.
The details display in the left panel of the Real Time Event Table.
To close the Event Details window in a Real Time Event Table of the Navigator or Snapshot, right-click an event, then click Show Details.
Sending Mail Messages about Events and Incidents
To send mail messages from within the Sentinel Control Center, you must have an SMTP integrator that is configured with connection information and with the SentinelDefaultEMailServer set to True. For more information on configuring the SMTP Integrator, see Configuring Integrators
in the NetIQ Sentinel Administration Guide.
To send an event message by e-mail:
-
In a Real Time Event Table, right-click an event or a group of events, then select Send Email.
The e-mail is sent to the specified recipients.
To e-mail an incident:
-
After you save your incident, click the Incidents tab, Incidents > Incidents View.
-
Click All Incidents in the Switch View drop-down list located at the bottom right corner.
-
Double-click an incident.
-
Click the Email Incident button.
-
Provide the following information:
-
Email Address
-
Email Subject
-
Email Message
-
-
Click OK.
The e-mail messages have .html attachments that address incident details, events, assets, vulnerabilities, advisor information, attachment information, incident notes, and incident history.
Creating Incidents
Creating an incident is useful in grouping a set of events together to indicate a pattern of interest, such an attack.
You must have the View or create incidents and add events to incidents permission to create incidents.
If events are not initially displayed in a newly created incident, it is probably because of a lag in the time between display in the Real Time Events window and insertion into the event store. It takes a few minutes for the original events to be inserted into the event store and displayed in the incident.
-
Access the Active Views tab.
For more information, see Section 2.2.1, Accessing the Active Views Tab.
-
In a Real Time Event Table, select an event or a group of events and right-click.
-
Select Create Incident.
-
Follow the steps in Section 16.2, Creating Incidents.
Adding Events to an Incident
You must have the View or create incidents and add events to incidents permission to add events to Incidents.
-
Access the Active Views tab.
For more information, see Section 2.2.1, Accessing the Active Views Tab.
-
In a Real Time Event Table, select an event or a group of events and right-click.
-
Select Add To Incident.
-
Click Browse, then click Search to list the available incidents.
You can define your criteria to better search for a particular incident or incidents in the Select Incident window.
-
Select an incident, then click Add.
-
Click OK.
If events are not initially displayed in a newly created incident, it is probably because of a lag in the time between display in the Real Time Events window and insertion into the event store. It takes a few minutes for the original events to be inserted into the event store and display in the incident.
Viewing Events That Trigger Correlated Events
-
Access the Actives Views tab.
For more information, see Section 2.2.1, Accessing the Active Views Tab.
-
In the Real Time Event Table, right-click a correlated event, then select View Trigger Events.
The View Trigger Events option is enabled only for Correlated events. Viewing the Targets. The events that generated the correlation event are displayed in the Sentinel Web interface.
Executing Actions on Events
You can execute the following actions on events:
-
Log to File
-
Log to Syslog
-
Send Email
-
Send SNMP trap
-
Send via Sentinel Link
-
Access the Actives Views tab.
For more information, see Section 2.2.1, Accessing the Active Views Tab.
-
In a Real Time Event Table, select an event or a group of events, right-click, then select the action you want to execute.
Investigating an Event or Events
You can use the Active Views tab to investigate events in two ways:
-
You can perform an event query for the last hour on a single event for:
-
Other events with the same target IP address
-
Other events with the same source (initiator) IP address
-
Other targets with the same event name
NOTE:You cannot perform a query on a null (empty) field.
-
-
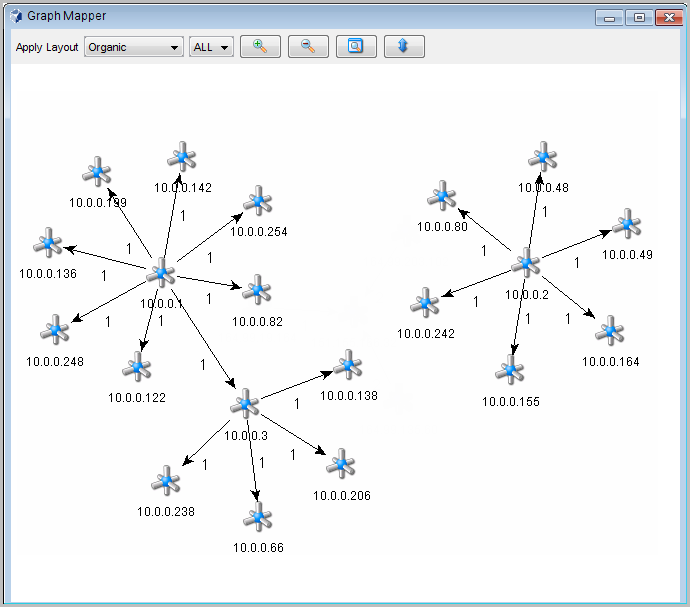
You can graphically display the mappings between any two fields in the selected events. This is particularly useful to view the relationship between the initiatiors (IP, port, event, sensor type, Collector) and the targets (IP, port, event, sensor type, Collector name) of the selected events, but any fields can be used
The following illustration shows initiator IP addresses mapped to target IP addresses.
Figure 2-3 Graph Mapper
Using the Investigate Option for an Event Query
You can perform an event query within the last hour for events similar to the selected event.
-
In a Navigator or Snapshot window, right-click an event, then click Investigate and select one of the options below:
Show More Events to this target: Events with the same destination IP address
Show More Events from this source: Events with the same initiator IP address
What are the target objects of this event?: Events with the same event name as the selected event.
The chosen event information is displayed in the Sentinel Web interface.
Using the Investigate Option with the Graph Mapper
To create a graph map:
-
In a Real Time Event Table, right-click one or more events, then select Investigate > Show Graph.
-
Select the desired information in the From and To fields, then click Finish.
-
In the Graph Mapper window, select how the information is displayed:
-
Circular
-
Hierarchical
-
Organic
-
Orthogonal
-
Accessing the Active Browser
The Active Browser provides the ability to browse through a selected set of data to look for patterns and perform investigation. You can view the selected events in the Active Views in the Active Browser. You can also perform all the right-click activities that are available in Active Views in the Active Browser.
Viewing Events in the Active Browser
-
Access the Active Views tab.
For more information, see Section 2.2.1, Accessing the Active Views Tab.
-
Select the events you want to view in the Active Browser.
-
Right-click the events, then select View in Active Browser.
The selected events display in the Active Browser window.
Searching in the Active Browser
-
Access the Active Views tab.
For more information, see Section 2.2.1, Accessing the Active Views Tab.
-
Specify the value or text you want to search for in the Search field, then click the Search button.
You can move between the various searches by using the Forward and Backward buttons above the search field.
Adding Attributes in the Active Browser
-
Access the Active Views tab.
For more information, see Section 2.2.1, Accessing the Active Views Tab.
-
Click the Add an attribute for categorization button.
-
Select an attribute from the list.
-
Click OK.
Viewing Advisor Data
Advisor provides a cross-reference between real-time intrusion detection system (IDS) attack signatures and Advisor's knowledge base of vulnerabilities. The supported intrusion detection systems are listed in Detecting Vulnerabilities and Exploits
in the NetIQ Sentinel Administration Guide.
To view Advisor data:
-
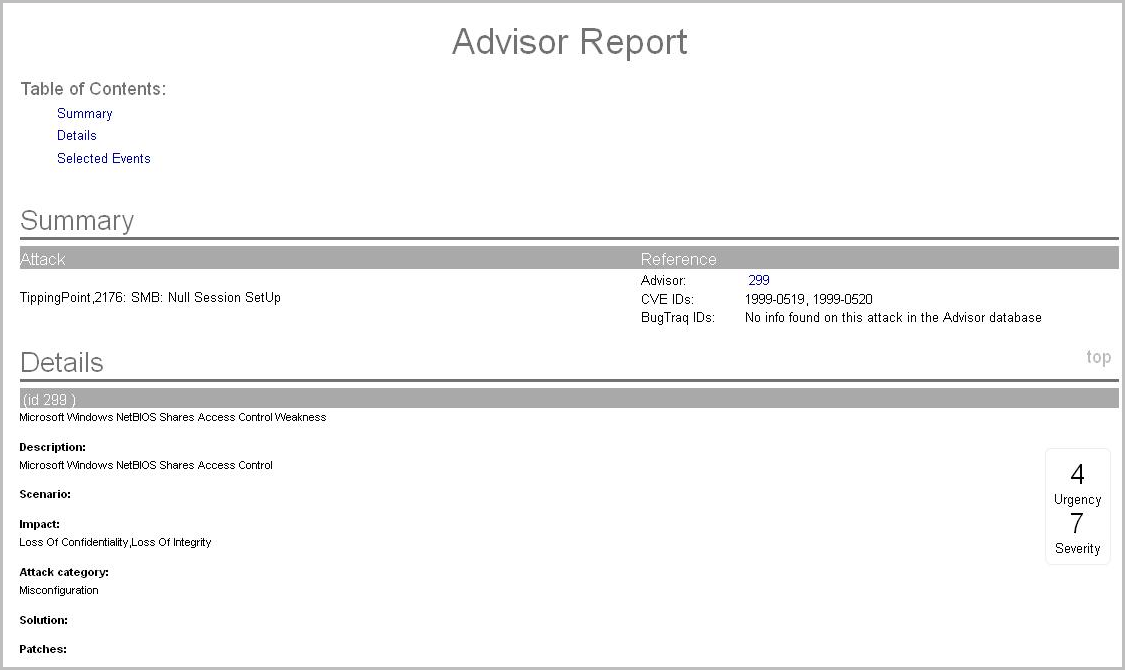
In a Real Time Event Table, right-click one or more events, then click Analyze > Advisor Data.
If the IDS AttackName field is properly populated, a report similar to the one below is displayed in the Sentinel Web interface.
Viewing Asset Data
This feature allows you to view and save your view as an HTML file of your Asset Report. To view the Asset data, you must run an asset management tool such as NMAP and bring the results into Sentinel by using an Asset Collector. The available data for viewing are:
-
Hardware
-
MAC Address
-
Name
-
Type
-
Vendor
-
Product
-
Version
-
Value
-
Criticality
-
-
Network
-
IP Address
-
Hostname
-
-
Software
-
Name
-
Type
-
Vendor
-
Product
-
Version
-
-
Contacts
-
Order
-
Name
-
Role
-
Email
-
Phone Number
-
-
Location
-
Location
-
Address
-
If both the Source IP and Destination IP are populated in an event, the asset data is displayed for both. If either of them is populated, the respective asset data is displayed.
To view asset data:
-
In a Real Time Event Table, right-click one or more events, then click Analyze > Asset Data.
The Asset data is displayed in the Sentinel Web interface.
Viewing Vulnerabilities
Vulnerability Visualization provides a textual or graphical representation of the vulnerabilities of selected destination systems. Vulnerabilities for the selected destination IPs can be seen for the current time or for the time of the selected events.
Vulnerability Visualization requires that a vulnerability Collector is running and is adding vulnerability scan information to the Sentinel database. The Sentinel Plug-in Web site provides Collectors for several industry-standard vulnerability scanners, and additional vulnerability Collectors can be written by using the Collector Builder.
NOTE:Vulnerability Collectors are distinct from Event Collectors and use different commands.
There are several Vulnerability Visualization views:
-
HTML
-
Graphical
-
Circular
-
Organic
-
Hierarchical
-
Orthogonal
-
The HTML view is a report view that lists relevant fields, depending on which vulnerability scanner you have:
-
IP
-
Host
-
Vulnerability
-
Port/protocol
The graphical display is a rendering of vulnerabilities that links them to an event through common ports. There are four available views:
-
Organic view
-
Hierarchical view
-
Circular view
-
Orthogonal view
The graphical display has four panels:
-
Graph panel
-
Tree panel
-
Control panel
-
Details/events panel
The graph panel display associates vulnerabilities to a port/protocol combination of a resource (IP address). For example, if a resource has five unique port/protocol combinations that are vulnerable, there are five nodes attached to that resource. The resources are grouped together under the scanner that scanned the resources and reported the vulnerabilities. If two different scanners are used, such as ISS and Nessus, there are two independent scanner nodes that have vulnerabilities associated with them.
NOTE:Event mapping takes place only between the selected events and the vulnerability data returned.
The tree panel organizes data in same hierarchy as the graph. The tree panel also allows users to hide or show nodes at any level in the hierarchy.
The control panel exposes all the functionality available in the display. This includes:
-
Four different algorithms to display
-
The ability to show all or selected nodes that have events mapped to them
-
Zooming in and out of selected areas of the graph
There are two tabs. When you are in the Details tab, click on a node displays node details. When you are in the Events tab, clicking an event associated with a node displays a table in a Real Time window.
To run a vulnerability visualization:
-
In a Real Time Event Table, right-click one or more events, then click Analyze and select one of the following options:
Current Vulnerability: Queries the database for vulnerabilities that are active (effective) at the current date and time.
Event Time Vulnerability: Queries the database for vulnerabilities that were active (effective) at the date and time of the selected event.
Viewing User Information
NetIQ provides optional integration with Novell Identity Manager. With this integration, user identity information is added to incoming events when the account name matches one from Novell Identity Manager. When the InitUserIdentity or TargetUserIdentity column is populated in an event, a right-click menu is enabled to open the user’s page in the Identity Browser.
When you right-click an event and select Show Identity Details, you can choose to view the identity of the Initiator user, the Target user, or both. The Identity Browser opens and shows identifying information about the user (or users) from the identity management system, all the accounts to which the user is provisioned, and the recent activity by that user. For more information on the Identity Browser, see Section 10.0, Leveraging Identity Information.
Viewing the Targets
You can view the targets of the events in the Real Time Event Table.
-
In an existing Real Time Event Table, right-click an event, then click Target.
-
Select one of the following options:
-
ping
-
Name server lookup
-
Trace Route
-
Whois?
The selected information is displayed.
-
Managing Columns
You can manage the columns displayed in the Active Views tab.
-
Access the Active Views tab.
For more information, see Section 2.2.1, Accessing the Active Views Tab.
-
Click Active Views > Event Real Time > Manage Columns.
-
Use the Add and Remove buttons to move column titles between the Available columns list and the Show these columns in this order list.
-
Use the Insert button to insert an available column item into a specific location.
-
Use the up-arrow and down-arrow to arrange the order of the columns as you want them to display in the Real Time Event Table.
The top to bottom order of column titles in the Manage Column dialog box determines the left to right order of the columns in the Real Time Event Table.
-
To save your changes, click OK.
-
(Optional) If you want your columns to display the next time you open the Sentinel Control Center, click File > Save Preferences.
Taking a Snapshot of a Navigator Window
You must have user permission to take a snapshot.
A snapshot is useful to study events of interest because the Navigator refreshes automatically and the alert or alerts of interest scroll off the screen. Also, within a snapshot, you can sort by column.
-
Access the Active Views tab.
For more information, see Section 2.2.1, Accessing the Active Views Tab.
-
In the menu, click Active Views > Event Real Time > Snapshot.
A Snapshot window opens and is added to the Snap Shots folder list under Active Views in the Navigator. The graphical display is not part of the snapshot.
To sort columns in a snapshot, click any column header once to sort by ascending value and twice to sort by descending value.