5.2 Using Feedback to Manage VMs
The VM Client is integrated with the Orchestrate Server and the Development Client to provide details from any Orchestrate jobs that are started by actions you take in the VM Client. This provisioning log integration enables you to see the current status on jobs that are running and to review the status of jobs that are finished. The information is provided in three levels: actions taken, provisioning logs, and job logs. You do not need to open the Development Client to discover the status of jobs started in the VM Client.
The ![]() icon is displayed in columns when a VM is in a progress state. The column can be viewed in the view and in the VMs sections of the tabs for host servers and templates.
icon is displayed in columns when a VM is in a progress state. The column can be viewed in the view and in the VMs sections of the tabs for host servers and templates.
Other actions cannot be performed on a VM when it is in a progress state (the ![]() icon) because Orchestrate jobs are run sequentially per VM.
icon) because Orchestrate jobs are run sequentially per VM.
If you double-click a VM that is in a progress state, its tab is immediately displayed.
All logging information is dynamically updated so that you do not need to refresh or return to a view to see event changes.
Even if you log in and log out of the VM Client, all logs are maintained and continue to progress so that you can still monitor an action after logging back in to the VM Client.
You can view the progress of any action, including error information, using the following features:
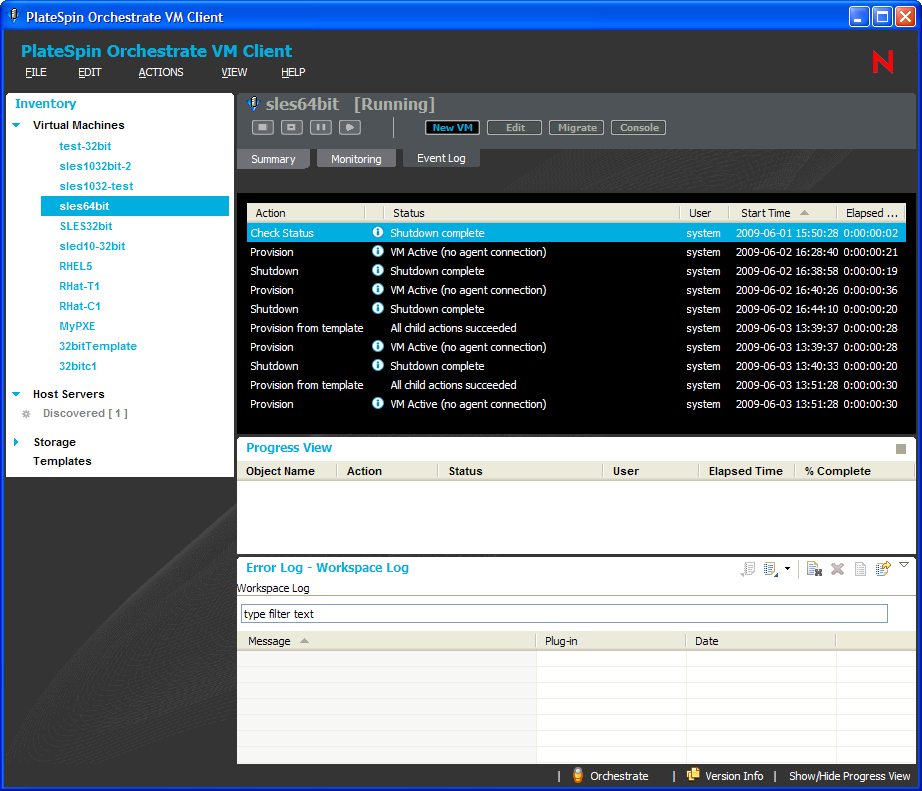
5.2.1 Progress View
The Progress View displays the progress of all VM actions initiated by any VM operator. To use the Progress View:
-
The Progress View section is displayed by default; if it is not being displayed, do one of the following:
-
In the VM Client, click > .
-
In the VM Client, double-click in the lower right corner of the VM Client window.
The following view is displayed:

-
-
For another view of the progress bar with other information, mouse-over the
 icon in the column for the Inventory item:
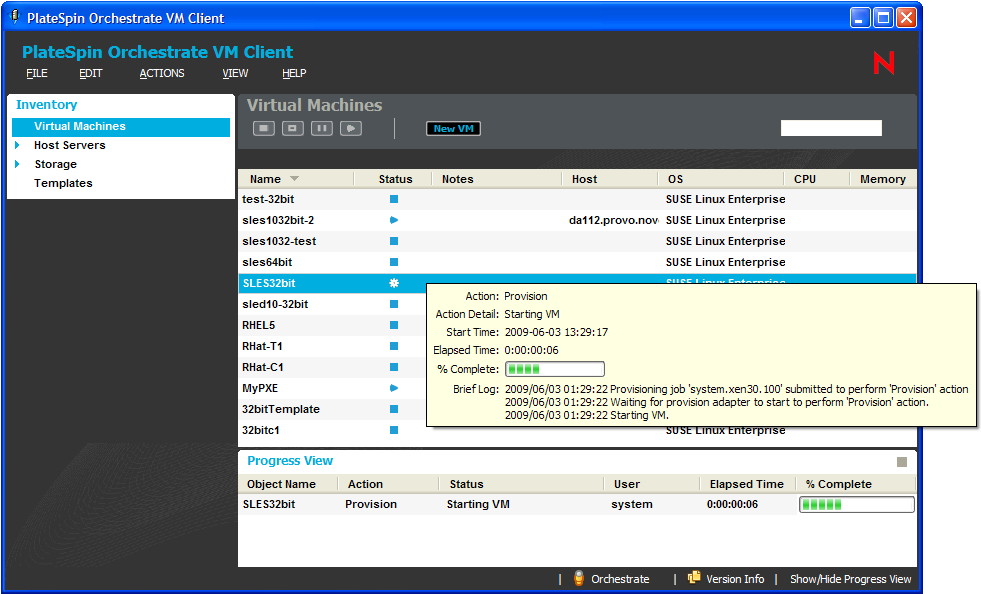
For more information, see Section 5.2.3, Progress Bar in a Tool Tip.
-
To view information specific to a progress task, mouse-over the name in the column of the section:
For more information, see Section 5.2.5, Event Logs.
5.2.2 Progress Bar for Details Views
If you start an action on a VM from within a details view, a progress bar is displayed in the upper right of the VM Client window. To view it:
-
To get a VM in an action state, in the host server’s tab, right-click a VM and select an action.
-
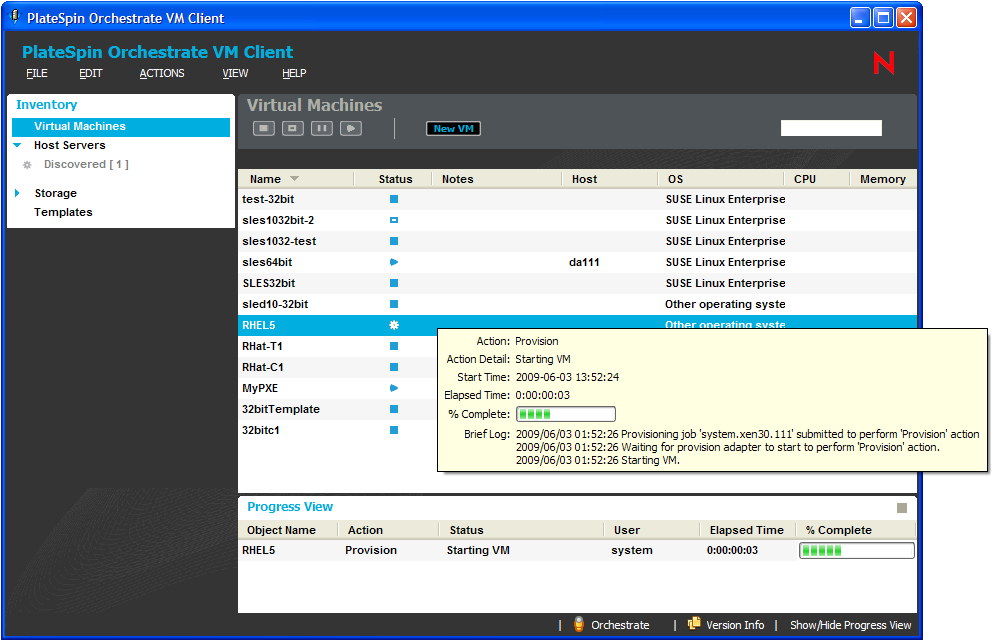
To view a progress bar on the host server’s details tab view, mouse over the VM:

-
In the view, double-click the VM.
This changes the to details view to of the VM and displays the progress bar and progress description in the upper right of the VM Client window:

The progress bar shows the percentage completed. It only displays for a selected VM that has an action in progress.
-
To view the log information, do one of the following:
-
Single-click the text to the left of the progress bar:

-
Double-click the progress bar:

This opens the Event Log dialog box:

You can click any
icons that are displayed for more detailed log information.
-
5.2.3 Progress Bar in a Tool Tip
There are two places where you can use the mouse-over function to view progress information:
-
You can view the progress of an action by mousing over its
 icon in the column of the view, or the column of the tabs for host servers and templates:

-
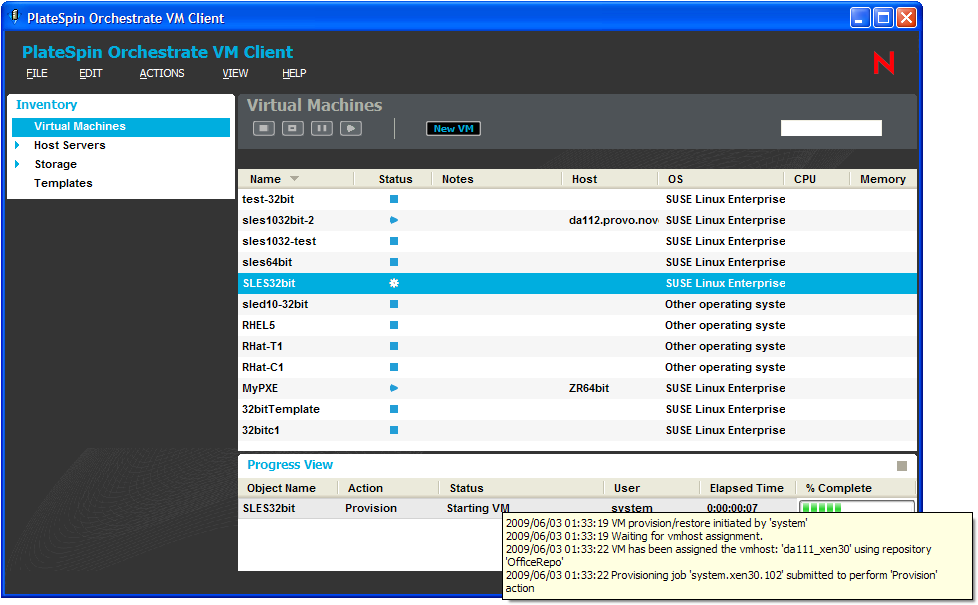
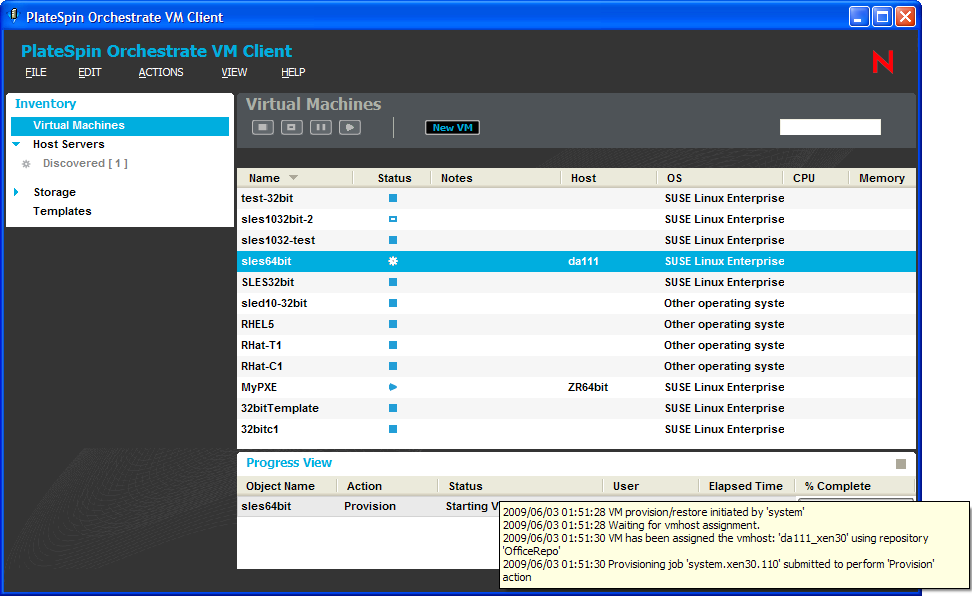
You can view the status log of the action by mousing over the entry in the column in the Progress View:
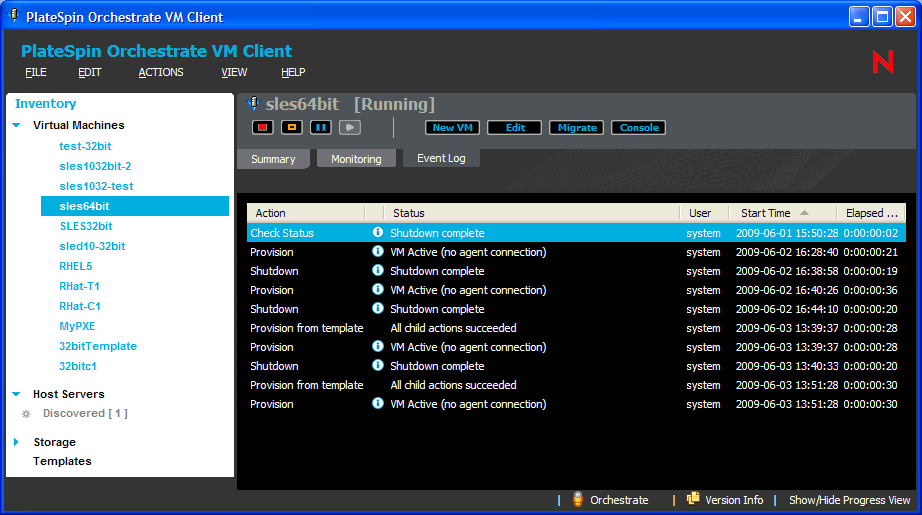
5.2.4 Event Log Tab
You can view the progress of all actions for a VM by viewing its tab:
-
In the VM Client, click to display the VMs, then do one of the following to open its details views:
-
Double-click the VM, then click the tab.
-
Right-click the VM, select , then click the tab.
The following view is displayed:
-
-
To view the information in a different order, click any column to sort by that column.
Click the column again to reverse the sorting order.
-
To quickly locate specific information, click anywhere in the list, then begin typing a search string.
This opens the locator pop-up and selects the first match. You can modify the string to refine the search, and you can use the up-arrow and down-arrow to move from match to match.
-
To view more detailed information for an entry, double-click its
icon.
For more information, see Section 5.2.5, Event Logs.
5.2.5 Event Logs
You can view the progress of an action by accessing its individual event logs:
-
In the VM Client, do one of the following to open the section:
-
In the VM Client, click > .
-
In the VM Client, double-click in the lower right corner of the VM Client window.
The following view is opened:
-
-
In the section, do one of the following:
-
Double-click the entry that is displayed in the column.
-
Right-click the entry that is displayed in the column and select .
The following dialog box is displayed:
These events are logged dynamically in the Event Log dialog box. Events with the
icon provide further detail (see Step 5).
You can also view this dialog box for VMs that are in an unknown state (the
 icon).
-
-
To view the information in a different order, click any column to sort by that column.
Click the column again to reverse the sorting order.
-
To quickly locate specific information, click anywhere in the list, then begin typing a search string.
This opens the locator pop-up and selects the first match. You can modify the string to refine the search, and you can use the up-arrow and down-arrow to move from match to match.
-
For further job details on an event, double-click its
icon:

These details are logged dynamically in the Event Log Details dialog box.
Only the entries that have further job information available have the
icon in the column.
You can have multiple Event Log Details dialog boxes open simultaneously to monitor multiple tasks for the same VM or for multiple VMs.
The Event Log Details dialog box provides the same information as the Job Details dialog box in the Development Client.
5.2.6 Error Log
To use the section:
-
In the VM Client, click > to display the section:
-
To view further information on an error, double-click the error to display its Event Details dialog box:
