3.8 Walkthrough: Looking at the Job After It Has Run
After you have run the job, there are several ways to verify that it has run. This section explains those methods.
3.8.1 Verification at the Command Line
The following sections explain some of the zos commands that you can use to verify that a job has run and monitor some of the results of the job:
zos jobs
You can use the zos jobs command to list all of the jobs that have run while you have been logged in as a user. Running this command yields an output like this:
Job        JobID           User       Started             Elapsed  State
whoami      userA.whoami.60  userA       12/24/2008 02:35:38  0:00:00   Completed
zos jobinfo job_name
You can use the zos jobinfo -e job_name command to display information for a named job the last time it was run. Running this command yields an output like this:
Jobname/Parameters    Attributes
------------------    ----------
whoami             Desc: This is a demo example of enhanced exec

    numJoblets     Desc: The number of joblets to schedule
                   Type: Integer
                Default: 1

    resource       Desc: The resource id to run on
                   Type: String
                Default: .*
zos status --detail
You can use the zos status --detail command to display the status of the most recently run job. Running this command yields an output like this:
Job Status for userA.whoami.60
------------------------------
              State: Completed
     Resource Count: 0              (0 this job)
   Percent Complete: 100%
          Queue Pos: n/a
    Child Job Count: 0              (0 this job)
      Joblet Counts: 1 (0)          (1 (0/0/1/0/0) this job)

      Instance Name: whoami
           Job Type: whoami
               Memo:
           Priority: medium
          Arguments: resource=tszen4_agent

        Submit Time: 12/24/2008 02:35:38
      Delayed Start: n/a
         Start Time: 12/24/2008 02:35:38
           End Time: 12/24/2008 02:35:39
       Elapsed Time: 0:00:00
         Queue Time: 0:00:00
         Pause Time: 0:00:00

     Total CPU Time: 0:00:00        (0:00:00 this job)
      Total GCycles: 0:00:00        (0:00:00 this job)
         Total Cost: $0.0002        ($0.0002 this job)
          Burn Rate: $0.8982/hr     ($0.8982/hr this job)

   Termination Type: n/a
          Job Error: <none>

 Joblet Error Count: 0              (0 this job)
   Node Error Count: 0              (0 this job)
     Excluded Nodes: 0              (0 this job)

Bad Provision Count: 0              (0 this job)
Excluded Provisions: 0              (0 this job)
zos log job_id --verbose
If you know the Job ID for a particular job that has run, you can use the zos log job_id --verbose command to display its detailed job log. Running this command yields an output like this:
Agent connected with ID: user_userA_64 (comms ok), Session ID: 52
Launching 1 joblets for user 'userA'
[tszen4_agent] cmd=whoami
[tszen4_agent] root
[tszen4_agent] result=0
Agent ID: null logged out.
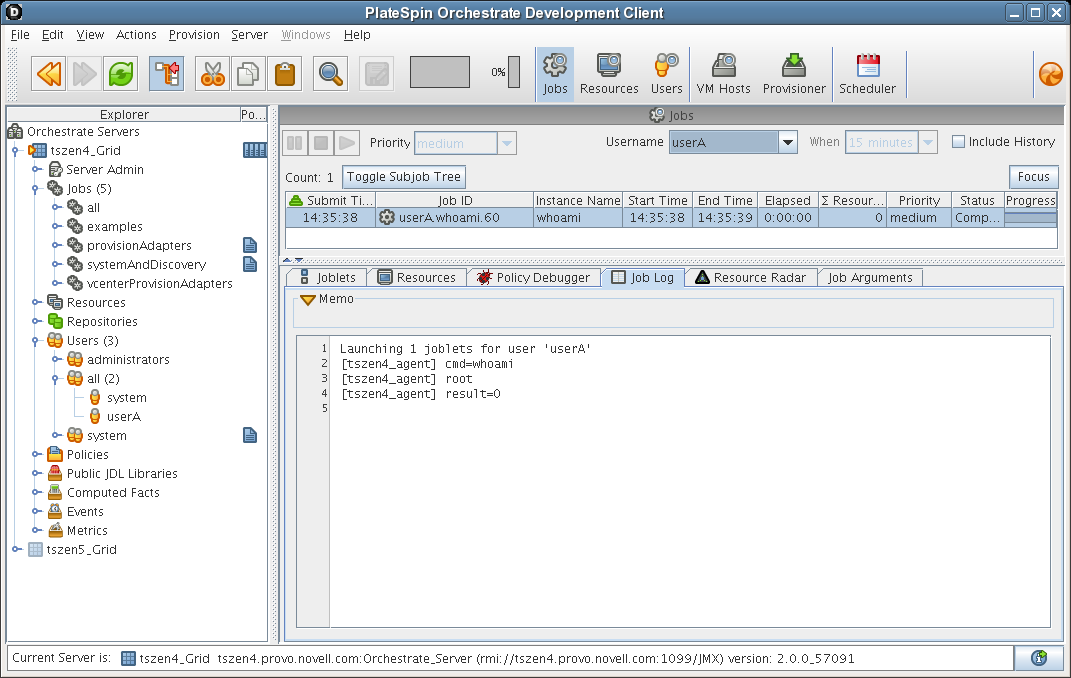
3.8.2 Verification at the Jobs Monitor
If you want to use the PlateSpin Orchestrate Development Client to verify that the job has run, you can open the Monitor to look at the Job Log and see the result of the job being run.
-
In the Development Client, click in the main toolbar to open the Jobs Monitor view.
-
In the Jobs Monitor view, click the tab to open the Jobs page in the workspace panel.
-
In the drop-down list box, select the user who ran the whoami job.
Although there is much more you can learn about a job in the Jobs Monitor view, you can see by displaying a recent job that the Development Client picks up the job activity and makes it available at the Development Client.
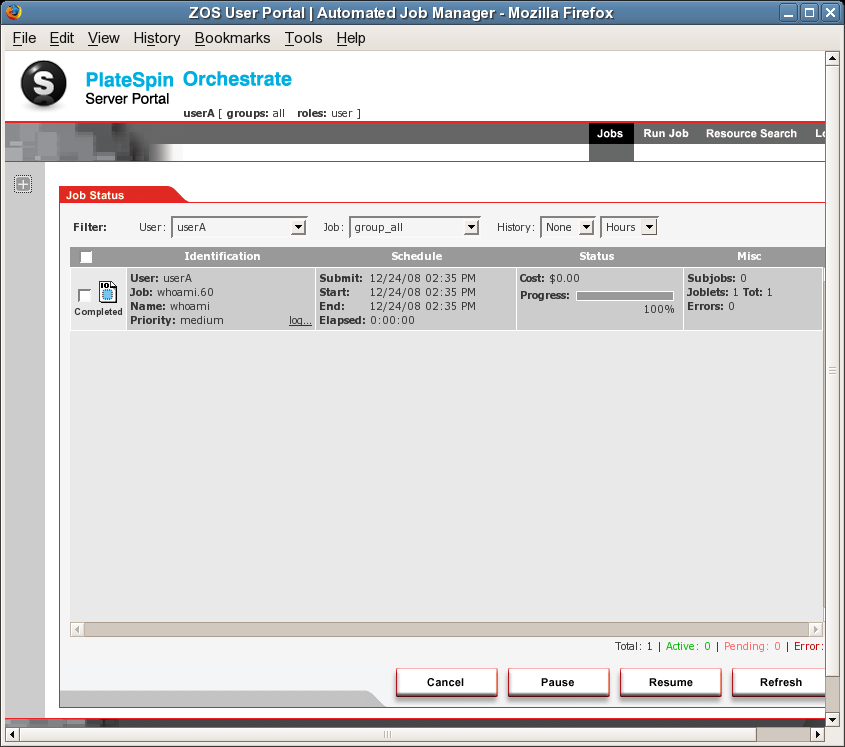
3.8.3 Verification at the Server Portal
Your data center might have an individual whose main function is to regularly schedule and run jobs on data center resources. That person, the job manager or PlateSpin Orchestrate user, uses a graphical interface called the PlateSpin Orchestrate Server Portal. This section introduces the Server Portal and how you can use it to verify that a job has run.
-
On any machine with a Web browser, enter the following URL:
Orchestrate_Server_DNS_Name_or_IP_Address:designated_User_Portal
For example:
10.255.255.255:80
(The default port is 80, unless you have ZENworks Monitoring installed.) When you enter the URL, the Server Portal is displayed in the browser.
-
Verify that the job you ran is displayed in the history of the Server Portal.
-
Click the link in the column of the job history to open the job log.
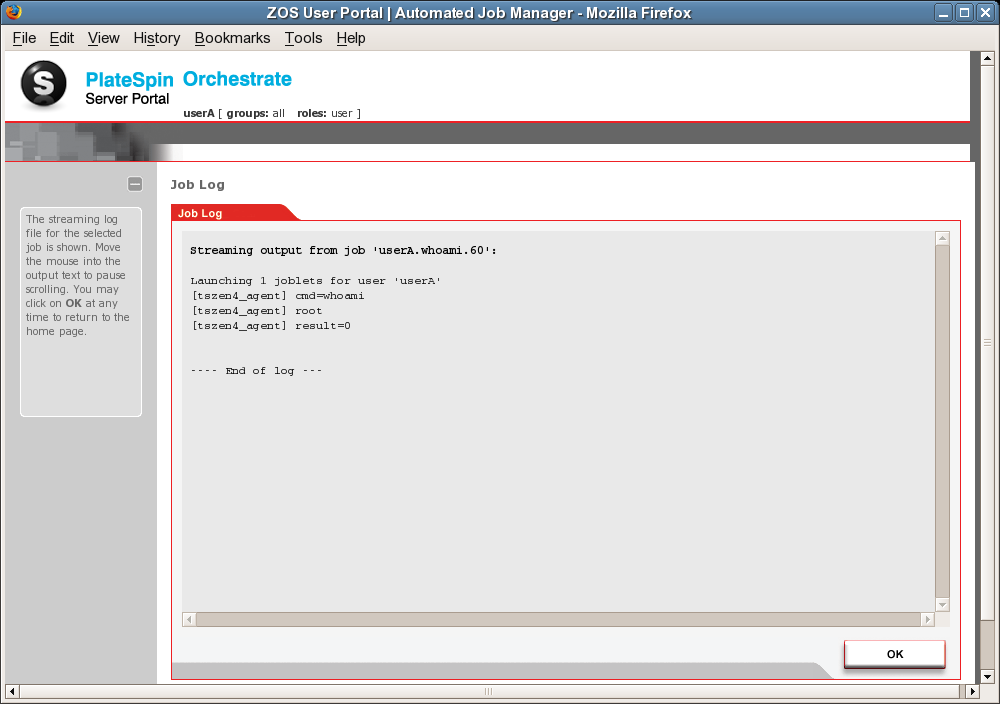
You now have a basic understanding of the Server Portal and how to use it to verify that a job has run. As the last experiment in the walkthrough for PlateSpin Orchestrate, you can use the zosadmin command line to gather information about your system. For more information, see Section 3.9, Walkthrough: Using the zosadmin Command to Gather Information.