2.8 Monitoring Job Results
PlateSpin Orchestrate lets you monitor jobs by using the same methods outlined in Section 2.7, Running Your Jobs.
This section includes the following information:
2.8.1 Monitoring Jobs from the Command Line
The following example shows the status of the job ray.buildtest.18 using different monitoring interfaces:
zos status -e ray.buildtest.18

Job Status for ray.buildtest.18
-------------------------------
              State: Completed      (0 this job)
     Resource Count: 0
   Percent Complete: 100%
          Queue Pos: 1 of 1 (initial pos=1)
    Child Job Count: 0              (0 this job)


      Instance Name: Buildtest
           Job Type: buildtest
               Memo: Build Test BuildID 02-02-09 1705 , failed: 1, Run: 5,
                     Passed: 4
           Priority: medium
          Arguments: <none>

        Submit Time: 02/02/2009 01:46:12
      Delayed Start: n/a
         Start Time: 02/02/2009 01:46:12
           End Time: 01/01/1009 01:46:14
       Elapsed Time: 0:00:01
         Queue Time: 0:00:00
         Pause Time: 0:00:00

     Total CPU Time: 0:00:00        (0:00:00 this job)
      Total GCycles: 0:00:00        (0:00:00 this job)
         Total Cost: $0.0002        ($0.0002 this job)
          Burn Rate: $0.0003/hr     (0.0003/hr this job)
The bottom section of the status report shows that you can also monitor job costing metrics, which are quite minimal in this example. More sophisticated job monitoring is possible.
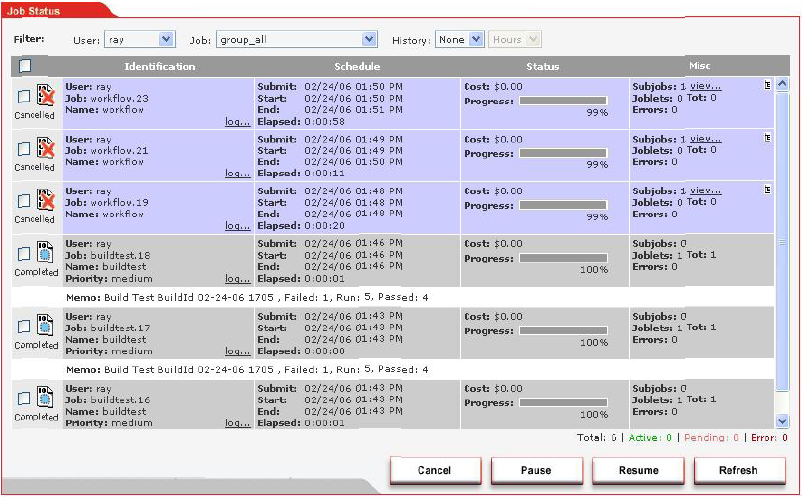
2.8.2 Monitoring Jobs from the Server Portal
You can use the status page of the Server Portal to monitor jobs. In this example, the job memo field is displayed.
Figure 2-11 Server Portal Job Monitoring Example