6.7 Viewing Consolidation Reports
Consolidation reports are used for analysis. Unlike other PlateSpin Recon reports, which are generated through the Report Explorer, consolidation reports are generated through the Project Explorer. Like other PlateSpin Recon reports, generated consolidation reports are viewed in the Document Viewer. In addition, consolidation reports cannot be saved and must be generated whenever necessary.
The following types of consolidation reports are available:
-
Project Report
-
Scenario Summary Report
-
Workload Assignment Report
-
Unconsolidated Report
-
Unprotected Report
Project, scenario summary, and workload assignment reports are template based. You can edit the templates through the Report Explorer. For information about editing consolidation report templates, see Section 5.3.3, Consolidation Report Templates.
For detailed information about the different types of consolidation reports, review the following sections:
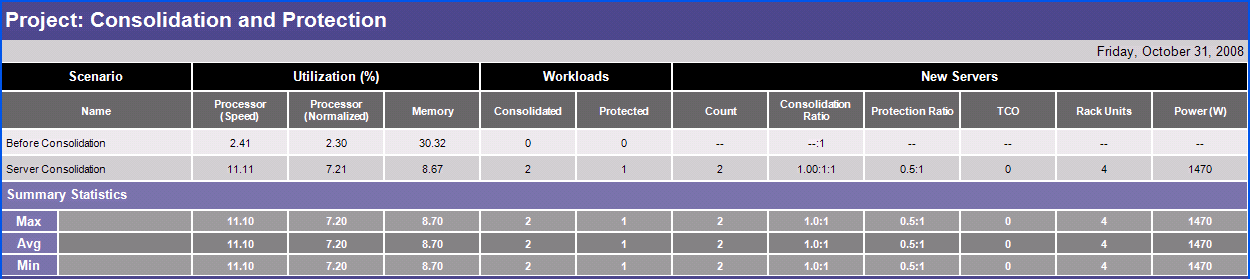
6.7.1 Project Report
A Project Report provides a comparison of consolidation scenarios.
To view this report, double-click a project. The Project Report is displayed in the Document Viewer.
Figure 6-2 Sample Project Report
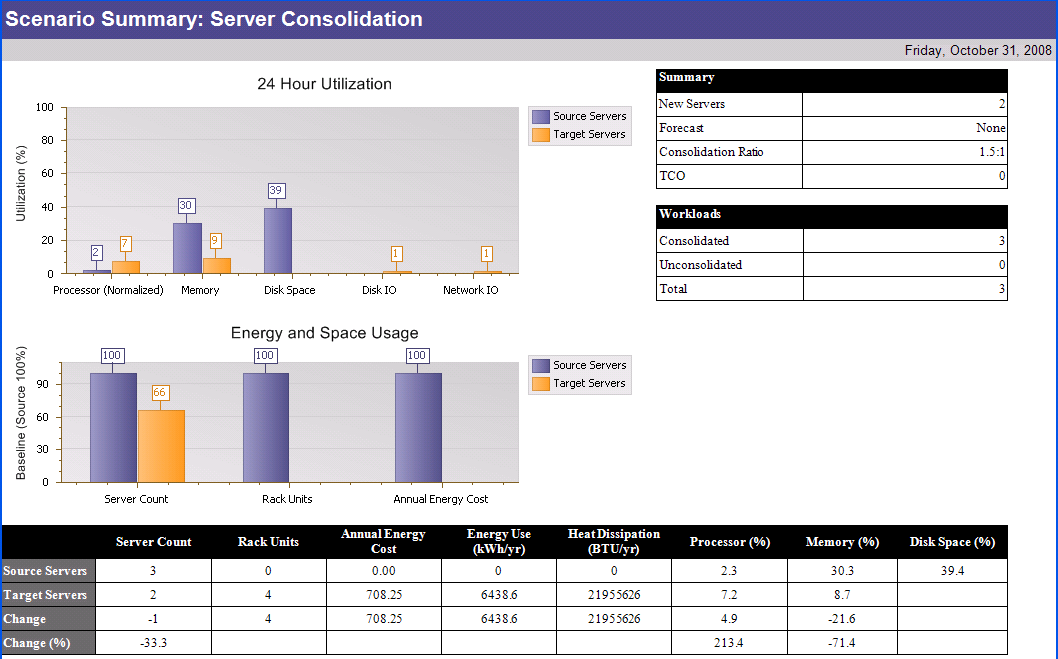
6.7.2 Scenario Summary Report
The Scenario Summary Report helps in assessing the value of using a particular infrastructure for server consolidation.
Double-click the selected scenario to view the Scenario Summary report in the Document Viewer and the 24H Profile Stacked Utilization chart in the Chart Viewer.
Figure 6-3 Sample Scenario Summary Report
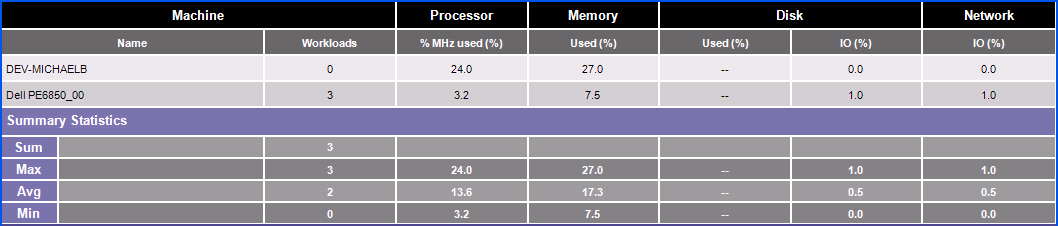
If there are multiple target servers, a summary statistics table is displayed with SUM, AVG, MAX, and MIN values.
Figure 6-4 Sample Report Summary Statistics Table
If you click one of the server cells, the corresponding 24H Profile stack chart with all workloads assigned to the target server is displayed.
Figure 6-5 Sample 24H Profile Stack Chart
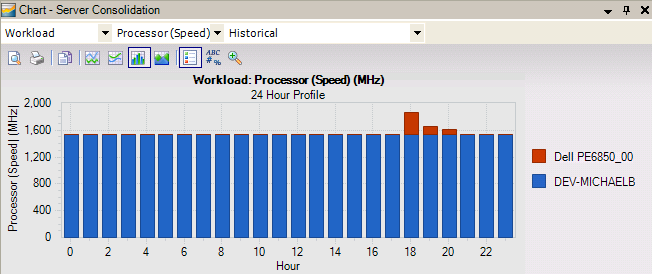
24H Profile Chart Appearance
Twenty-four hour (24H) Profile charts in the Data Center Explorer and in Consolidation Planning are slightly different. In the Data Center Explorer, the 24H profile that is shown. select several monitored machines, click and then select Profile as the type of chart) in workload profile charts is for each individual resource instance separately and shows a different color for each instance and resource. These values are stacked for each given hour. This gives the maximum value for every instance for a specific hour over the monitoring period. These stacked values are then summed.
Figure 6-6 Summed Stack Values
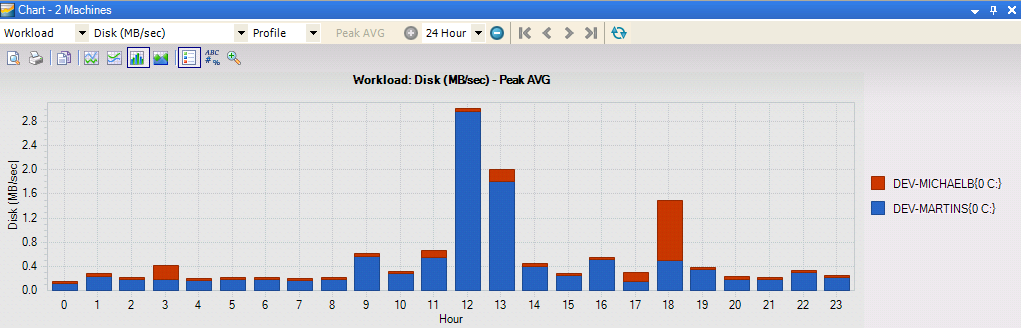
This highlights the hour with the maximum utilization for a specific instance of the resource. This approach is particularly useful for determining maximum utilization of any individual resource instance.
In Consolidation Planning, the 24H chart has the values of the instances and resources summed for each time moment and then the maximum of this sum for every hour is identified.
Figure 6-7 Consolidation Planning 24H Chart
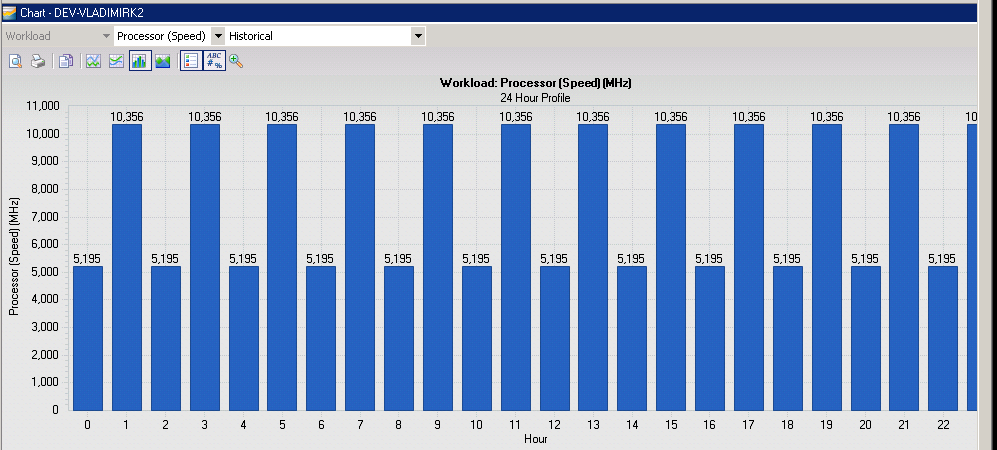
This is needed to determine the summary resource consumption of a workload.
6.7.3 Workload Assignment Report
In the Workload Assignment report, you can see which workloads are assigned to servers and how workloads are utilized in each of these assigned servers. You can modify workload assignments according to requirements and consider different kinds of server options while creating a project.
Workload Assignment reports are available for individual target servers or for all target servers included in a scenario.
Individual Server
To view the Workload Assignment report and 24H Profile chart, double-click a target server in the .
NOTE:A 24H Profile cannot be created for workloads when there is no one-hour summary data.
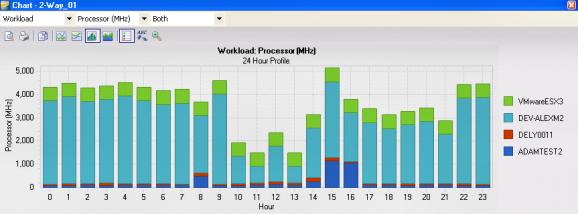
If you click one of the servers in the Assignment report, the corresponding 24H Profile stack chart with all workloads assigned to the target server is displayed. The utilization values displayed are for the target servers.
Figure 6-8 Assignment Report Generated 24H Profile Stack Chart
All Servers
To view the Workload Assignment report for all the servers in the current scenario:
-
Right-click a scenario, select > from the drop-down menu
6.7.4 Unconsolidated Workload Report
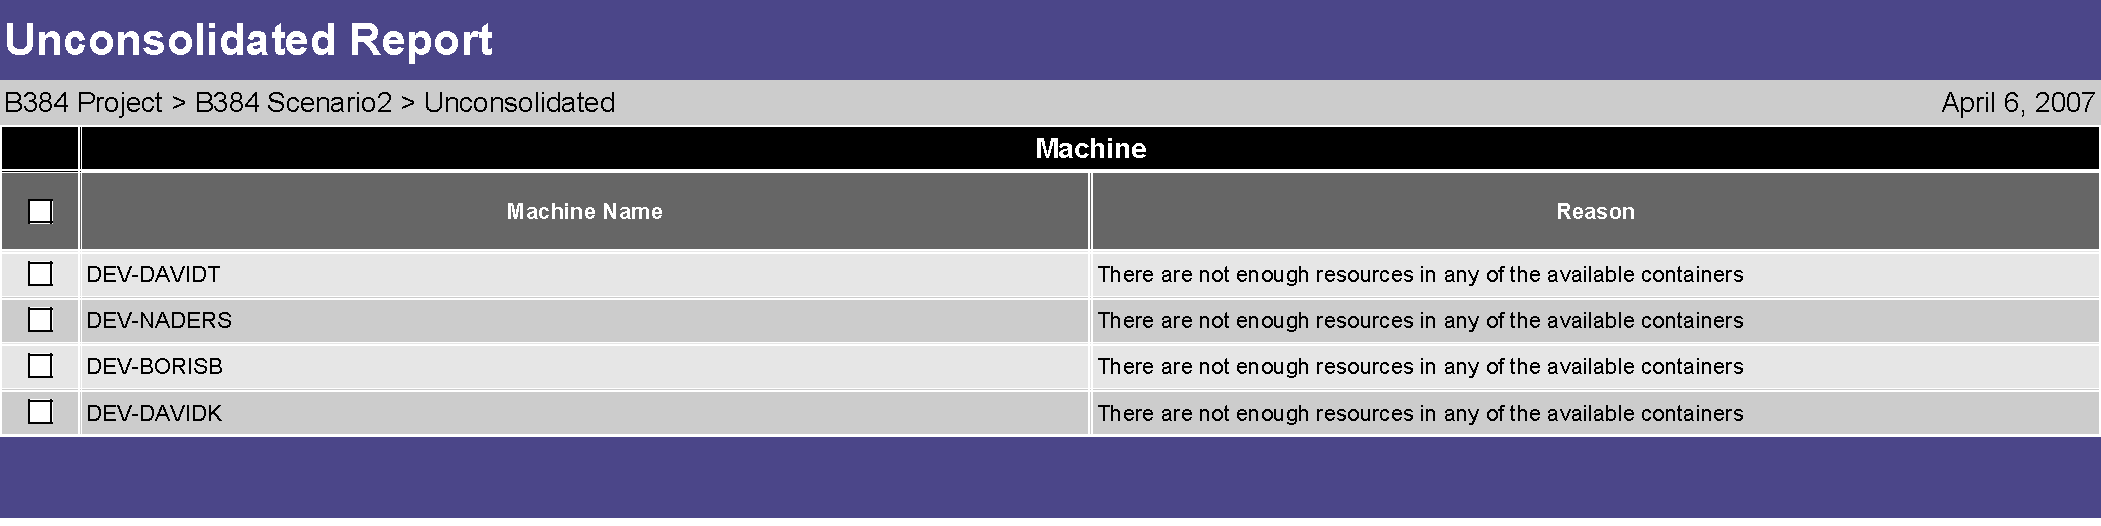
In the Unconsolidated Workload Report, you can see which of the consolidation candidate workloads are not included in the consolidation plan, as well as an explanation of the reason why PlateSpin Recon could not include them.
To view this report, right-click a scenario and select . The Unconsolidated Report is displayed in the Document Viewer.
Figure 6-9 Sample Unconsolidated Report
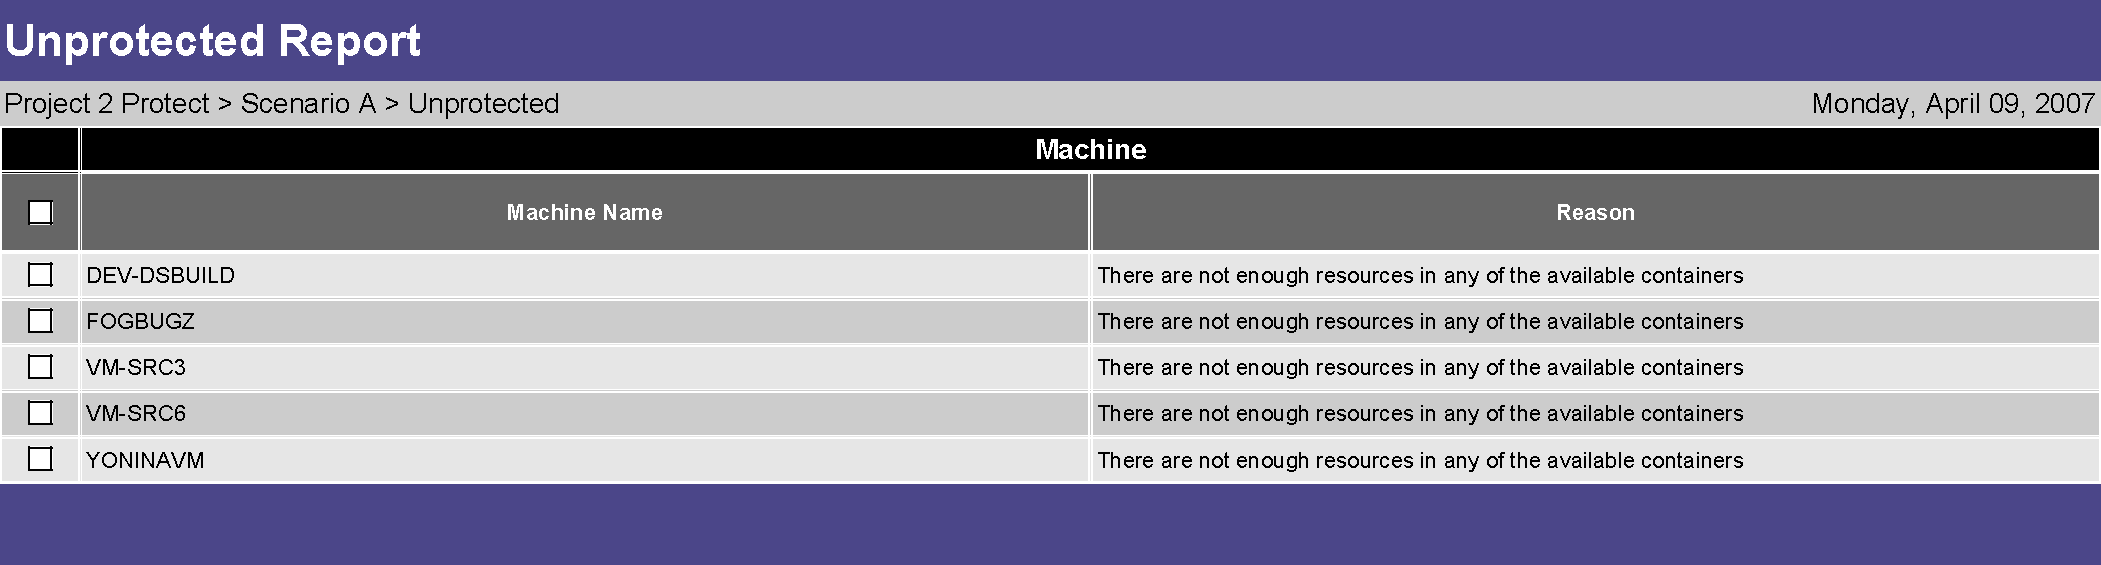
6.7.5 Unprotected Workload Report
In the Unprotected Report, you can see which of the consolidation candidate workloads were not included in the protection plan, as well as an explanation of the reason why PlateSpin Recon could not include them.
To view this report, right-click a scenario and select . The Unconsolidated Report is displayed in the Document Viewer.
Figure 6-10 Sample Unprotected Report