5.6 Document Viewer
To display a report in the Document Viewer, generate a report from a report template and then double-click the instance of the report or double-click a report instance you previously generated. See Section 5.5, Generating Reports.
Figure 5-11 Report Displayed in the Document Viewer
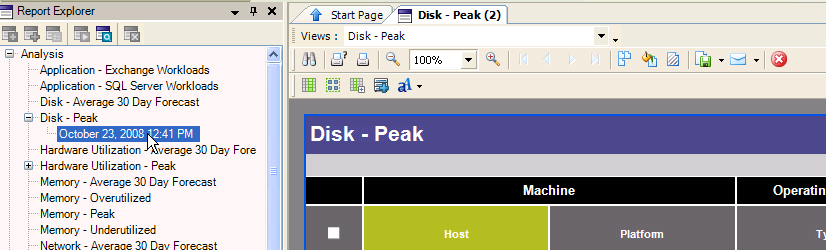
A new tabbed page is added to the Document Viewer, showing the report through its first available view. To switch to a different view, click the drop-down list and select a view. For more information on views, see Section 5.4.1, Creating and Editing Report Views.
5.6.1 Commands
Table 5-6 Document Viewer Commands
|
Commands |
Tooltip/Description |
|---|---|
|
|
Columns. Select columns content for viewing. |
|
|
Groups. Add, or modify existing grouping in a report. |
|
|
Matrix. Add or modify existing matrixes in a report. |
|
|
Copy to Group. Copy selected servers to a group. |
|
|
Font Size. Change font size (small, medium, or large). |
|
|
Print/Quick Print. Show the Print Options dialog box to allow you to pick a printer and its settings, or just print the report immediately with the current default printer and settings. |
|
|
Search. Opens a Find dialog box for searching. |
|
|
Zoom Out, Zoom Percent, Zoom In. Zoom in or out incrementally/decrementally, or specify a zoom setting. |
|
|
Multiple Pages. Reduce the view zoom setting so you can view multiple pages of the report simultaneously. |
|
|
Color Background. Show a dialog box to allow you to set the background color of the report. |
|
|
Watermark. Show a dialog box where you can set a watermark for the report, such as DRAFT, TOP SECRET or an image. |
|
|
Export Document. Export to PDF, HTML, Text, CSV, MHT, Excel, RTF, or Image formats. |
|
|
Send via Email. Send the report through e-mail as an attachment. The file is saved locally first and then your default mail client is launched with the saved file attached. Possible file formats are PDF, MHT, RTF, Excel, CSV, Text, or an image format. |
|
|
Exit. Close the report preview page. |


5.6.2 Customizing Reports
After a report is generated, it can be further adjusted and customized. This includes revising which columns to include in the report, changing the font, and adding or modifying grouping or matrixes. These customizations are displayed in the Document Viewer and are included in the report when it is exported, but are not saved to the template.
Customizing Columns
-
Click
 in the Document Viewer.
The Report Column Selection dialog box is displayed.

-
Select a column and use the arrow buttons to rearrange how it appears in the report (the higher the column in the tree hierarchy, the more to the left it appears in the report). Conditional formatting can be selected for numeric fields. Select custom colors and breakpoints, or use the default settings.
The report will highlight the following:
-
All the values less than the with the
-
All the values between the and with the
-
All the values greater than the with the .
Selecting leaves the values without highlights.
-
-
Sort the report by selecting a criterion from the drop-down list. Select or order. For grouped reports, this controls the order within the group, because the whole report is sorted by the grouping column.
Optionally, add summary rows to the table by selecting from the check boxes in the area. PlateSpin Recon calculates and displays the , , , or for numeric columns.
Changing Report Font Size
-
Click
 .in the Document Viewer. A drop-down menu is displayed, showing the following options:
-
Small Font
-
Medium Font
-
Large Font
Click the desired font size. The changes are applied to the report displayed in the Document Viewer.
-
Adding or Modifying Groups
-
Click
 in the Document Viewer.
The Report Group Settings dialog box is displayed.

-
Click next to the upper list box to enter a group name.
-
In the Custom <groupname> Bins area, select the element to group by from the drop‑down list.
-
Do either of the following:
-
Select the option .
-
Click in the lower area to create and name a custom bin. Define an expression for each custom bin.
-
-
Select the desired sorting order for the group.
-
Select the summary rows to include in the table. These summarize the values for each bin.
-
To modify a group or a bin, select its name and edit it or its associated settings. Alternatively, click the appropriate button to delete the group or bin.
-
Click .
Adding or Modifying Matrixes
-
Click
 in the Document Viewer.
The Report Matrix Settings dialog box is displayed.

-
In the upper list box, select elements for creating a matrix.
-
For each selected element, enter a for its matrix.
-
Do either of the following:
-
Check to create a column for each unique value of the element.
-
Click to add custom columns. For each column, specify a name and define an expression.
-
-
Check to specify a value to place in the appropriate matrix cells. If this box is deselected, the values in the matrix columns are either True or False.
-
To remove a matrix from a report, deselect its check box. To modify a matrix, select it and modify its associated settings. Delete a bin by selecting its name and clicking .
5.6.3 Viewing Reports
Diagnostics Reports
Click a row in a Missing Data - Summary report to view the corresponding Missing Data - Detailed and Error reports.
Multiple Report Pages
To view multiple pages at once, click  . Select the number of pages across and the number of pages vertically to view simultaneously. The more pages viewed, the smaller the text. The options available are from 1X1 through 5X10 pages.
5.6.4 Printing and Exporting Reports
Click  to open the Print dialog box, or click
 to immediately print the report, using the current default printer settings.
Click  to export data to any one of formats, such as PDF, HTML, Text, CSV, MHT, Excel, RTF, or an image format. Select the desired format from the drop-down list. Click to automatically export data in the format most recently selected in the session. If a format has not yet been selected in this session, the default format is PDF.
Image Formats
After selecting to export a document as an , the Image Export Options dialog box is displayed.
Figure 5-12 Image Exports Options Dialog Box
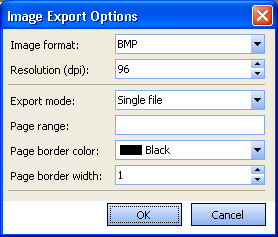
Use this dialog box to select from several image types to export, including bmp, emf, wmf, gif, jpg, png, and tiff. You can also specify the following options to control the actions output:
Resolution (dpi): Image resolution you want to use, keeping in mind that the higher the resolution, the bigger the exported file.
Export mode: Allows you to choose how you want to export the image:
-
single file: One long image with a single set of column headers at the top.
-
single file page-by-page: One long image made up of individual pages, each with a set of column headers at the top.
-
different files: A set of separate files, each with a single page image in it. When this option is selected, numbers are added to the end of the filename you specify for each separate file, incrementing until all the pages are exported. For example, if you specified MyImage.bmp for a two-page report, the two files exported would be named MyImage01.bmp and MyImage02.bmp.
Page range: Range of pages in the report to export. For example, to export the first five pages and the tenth page of a 20 page report, specify 1-5,10.
Page border color: The color to use for the report page border.
Page border width: The width of the page border.
5.6.5 Copying Servers from a Report to a Group
Sometimes it is useful to copy the displayed servers from a report to a Data Center Explorer group. Not all reports display servers, but those types of reports do not display the Copy To Group tool. The groups must already exist. See Section 3.4, Working with Groups.
To copy servers to a group:
-
Click the check boxes next to the servers in the report you want to add to a group.
-
Click
 .
.
The Copy To Group dialog box is displayed.

-
Select the target group and click . To exit without copying, click .