A.6 Step 5. View and Report on Service Level Agreements
There are several ways to view SLA data. Through Operations Center, it is easy to view what is happening in real time, because service level breaches and metrics are issued as performance is being evaluated based on the objectives set.
Then, results and statistics can be published to the Web using Operations Center dashboard’s SLA-related reports.
A.6.1 Viewing SLA Breaches and Metrics
To view SLA Breaches and Metrics:
-
In the pane, expand > .
-
Click .
-
Click the tab in the view pane to display the view.
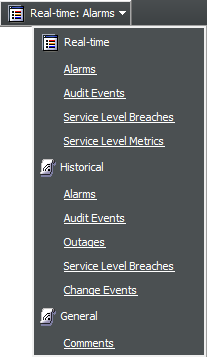
In the toolbar, the button provides several options to view SLA data, in real time or historically:
-
To view Service Level Breaches, click > , or click > .
For information on Service Level Breaches and alarm column types, see Section 6.1.1, Understanding Breach Alarms.
-
To view Service Level Metrics, click > .

For information on Service Level Metrics and alarm column types, see Section 6.2.1, Understanding Metric Alarms.
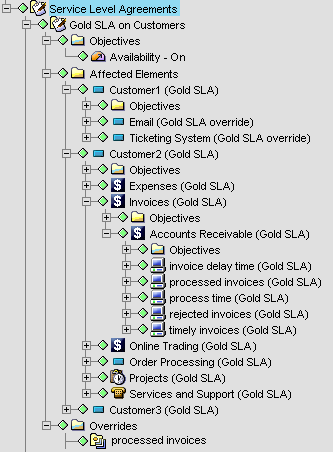
A.6.2 Viewing the Service Level Agreements Hierarchy
-
In the pane, expand > :
Figure A-2 Service Level Agreements Hierarchy
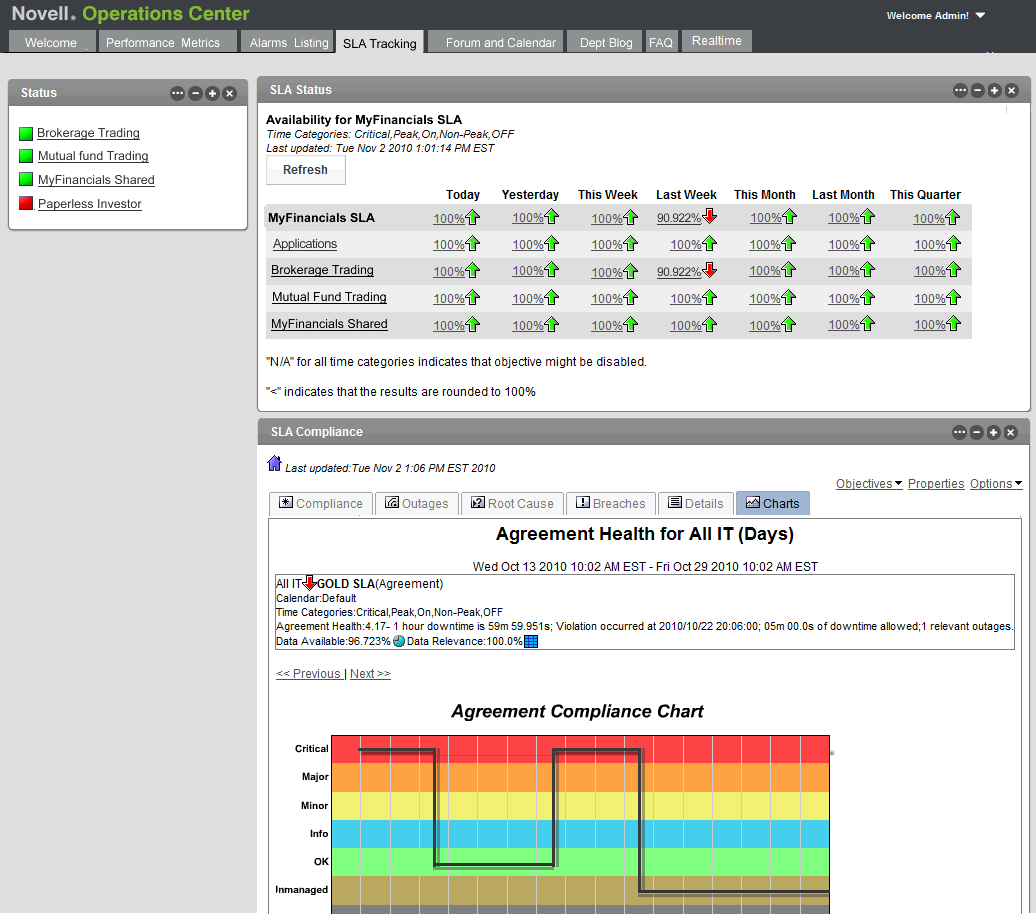
A.6.3 Viewing Service Level Data in the Dashboard
Portal pages can be created to display historical and real time SLA data. The Operations Center 5.6 Dashboard Guide is a useful reference that provides detailed information on how to create your portal and configure the views and reports.
Figure A-3 Portal Pages: Pages display historical and real time SLA data.