7.5 Understanding Breaches

A breach indicates that either an objective or an SLA is out of compliance, that is, it failed. Information on historical breaches is available as alarms and also as data in compliance reports. Breaches can also be viewed in real time as alarms.

7.5.1 Historical Breach Alarms

Historical alarm data can be viewed in the Operations Center console and in an Alarms portlet in the Operations Center dashboard.

A cleared breach can display without showing that it has been cleared if the action to clear it was taken after the selected time range being viewed. Also, a cleared alarm can display without any information about its original occurrence if it occurred outside the time range being viewed.

Existing historical breach information is not further updated if an agreement of definition is changed after the real-time data is calculated. For example, if data is imported that includes outages that have already occurred, Operations Center never has the opportunity to create a breach alarm that it would have if the outages were system generated in real time.

In the Operations Center console, historical data on service level breaches can be viewed in the Alarms view by selecting Historical: Service Level Breaches as the data type to view. Unlike real-time alarms, you must select a time period to view, then click Retrieve. The Alarms view shows the same types of data for historical alarms as it does for real time alarms.

The Alarms portlet in the Operations Center dashboard has the option to display historical data including service level breaches. The same data as displayed in the Operations Center console is displayed in a report on service level breaches. No actions can be taken on these breaches from this report.

Select the time period and the columns of data to be displayed. The report has the following options to filter out data according to severity type:

  • Show Major Breaches.  

  • Show Cleared Breaches: By default, cleared breaches including all warning and violation alarms associated with these breaches are not shown. Opt to include them in the report.

  • Roll Up Children Breaches: By default, all breach alarms issued by the element’s children that contribute to the objective or SLA are included in the report. They can be excluded.

Historical breaches are unavailable for manual outages as breaches are not created for manual outages as they would be for real-time outages. However breaches are simulated and included for manual outages in SLA reports. For more information, see Section 10.3, Understanding Manual Outages in Breach Reporting.

7.5.2 Breaches in Compliance Report

When running a compliance report using the SLA Compliance Report, opt to view breaches. By default, the report does not include objective breaches, major breaches, or cleared breaches, but you can opt to view these.
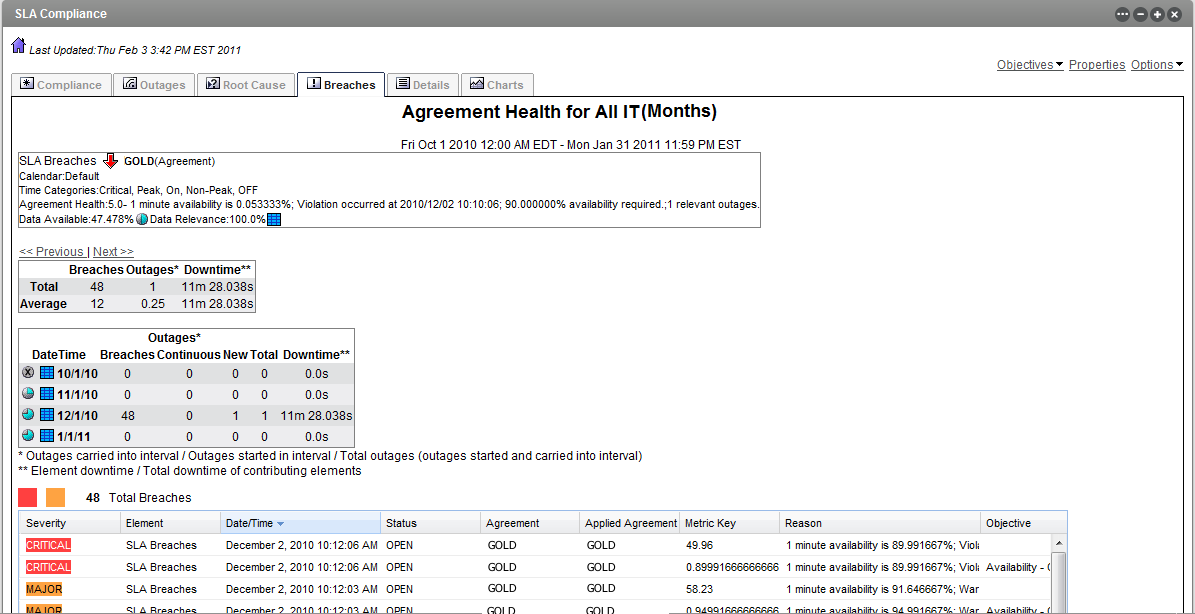
The Breaches tab of the report shows the number of breaches per selected interval, total number of breaches for the whole time period, and the average number of breaches over the whole time period. It also shows outages and downtime:

Figure 7-5 SLA Compliance Report: Compliance Report, Breaches Tab

Breaches are measured on the following:

  • Data Available: Amount of data available for the measured period of time as measured in a range of the following values:

    • 0%

    • 0.1%–33%

    • 33.1%–65.9%

    • 66%–99.9%

    • 100%

  • Data Relevance: Relevancy of data to the reported period of time. For example, there can be data available but it is not considered (not relevant) if the associated time category is filtered out. It is indicated by the following range:

    • 0%

    • 0.1%–33%

    • 33.1%–65.9%

    • 66%–99.9%

    • 100%