12.1 The High-Volume Metrics Framework
High-Volume Metrics (HVM) and End-User Metrics (EUM) are frameworks in the Experience Manager product that monitor the performance of Web sites as experienced by their users. Both frameworks collect performance data by embedding an instrumentation script in the pages of the Web sites to be monitored (the target Web sites). The instrumentation script is a customized JavaScript file that is provided with the product. As users browse through the target Web site, the instrumentation script executes in the user’s browser, measuring the performance of the target site and reporting this information to a Experience Manager monitor.
The End-User Metrics framework is designed to track individual hits by individual users on the target Web site. As performance data is received from the end user browsers, the monitor forwards this information to any connected Operation Center servers in the form of an alarm. There is typically a one-to-one correspondence between user page hits and Operations Center alarms that warehouse the resulting metrics. Each hit, on each page, from each end user system is reported as a Operations Center alarm. (The adapter hierarchy file is used to organize these alarms into Operations Center elements.) Subsequent hits from the same system on the same page updates that alarm, making it possible to track the history from the perspective of a particular IP address and/or a particular Web page. The EUM framework is quite simple to set up and is appropriate for use on intranet sites with no more than a few thousand users.
The High-Volume Metrics framework implements more scalable and flexible approach designed for Internet or intranet sites with an unlimited number of users. Instead of feeding the performance data for individual hits on the target Web site, data collectors are used to collect customized information about activity on the target site. The collected data are periodically reported to scripted handlers that use it to create and populate a custom Operations Center element hierarchy to capture collected metrics. Depending on several variables, including complexity of the HVM algorithms and the hardware where it is running, a single monitor can process up to 20,000 hits from end user browsers per minute. For environments with a higher flow rate, multiple monitors can be configured in a cluster to collaborate in collecting end user data to feed a common set of HVM algorithms.
While a sample HVM configuration is provided with the Experience Manager installation, initial configuration and customization of the HVM framework is much more involved than is set up for EUM.
12.1.1 Instrumentation Script
The instrumentation script produces the seed data that drives the HVM framework. It is included in each Web page of a monitored Web site and executes inside the browser of each end user that browses the site. As end users navigate from page to page in the monitored Web site, this script calculates the time required to navigate from one page to the next. After each page is loaded, the script sends a message to a Experience Manager monitor that includes information about what page was loaded and how long it took. The time reported by this script includes both time to retrieve the page components from the Web site, as well as the time to render those components in the end user browser.
How the Instrumentation Script Works
The instrumentation script calculates performance data by capturing three time points:
-
Before-unload: The onbeforeunload event is a standard event that the browser fires just before a new page is requested. For example, right after the user clicks a hyperlink, but before the browser sends a request to the new URL. The time this event fires is stored in a cookie so that it is visible to the script when the next page loads.
-
Page-initialization: This time point is captured immediately after the headers for the new page are loaded, but before the document body and its components are loaded and rendered.
-
Load-complete: The onload event is a standard event that is fired after the browser has completely loaded and rendered a page.
As a rule, the response time reported in HVM is the difference between the “before-unload” and the “load-complete” event. The exception to this rule is when the user enters the site—either for the first time, or after navigating away. In this case, only the period between “page-initialization” and “load-complete” is used.
Browser security restricts visibility of navigation history, so this special case is detected by setting a maximum threshold for the interval between “before-unload” and “page-initialization”. (This interval is called “upload time” and the threshold limiting its use, called uploadTimeLimit, is set in the preprocessor.)
When “load-complete” is detected, the browser sends the URL parameters listed in Table 12-1 to a Experience Manager Monitor.
Table 12-1 URL parameters sent to the Experience Manager Monitor by the browser.
|
Field Name |
Parameter Name |
Description |
|---|---|---|
|
Application Name |
“an” |
Name of the application being monitored. This value is configured in the instrumentation script. By using different values, different Web sites or applications within a Web site can be easily distinguished. |
|
URL |
“rl” |
URL of the loaded page as retrieved from the browser’s “document” object. |
|
Title |
“ti” |
Title of the page as retrieved from the browser’s “document” object. |
|
Upload Time |
“ut” |
Number of milliseconds between “before-unload” and “page-initialization.” |
|
Download Time |
“dt” |
Number of milliseconds between “page-initialization” and “load complete.” |
|
User Agent |
“ua” |
Describes the user’s browser and version. Retrieved from the browser’s “navigator” object. |
Upon receiving this request from the browser, the Experience Manager monitor interrogates the TCP/IP connection from the browser to retrieve the IP address of the client that sent the information and include that with the received data. Note, this IP address is not useful if the monitor is sitting behind a Virtual IP server.
How to Use the Instrumentation Script
A template of an HVM instrumentation script is included with the Experience Manager installation in the OperationsCenter_ExperienceManager_install_path/hvm-template/ directory. Before loading the file onto a Web site you wish to monitor, you must set configuration parameters located at the top of the file. Typically, the only variables that might need to be changed are the following:
-
appName: Set this variable to identify the application being monitored.
-
posttLoc: Set this variable to the URL of the Experience Manager monitor Web server. By default, this is:
http://monitor_machine_name:8080
After you have set these variables, save the updated file and load it onto the Web server that is to be monitored. Update the <HEAD> section of each page to include an empty IFRAME called experiencemanager and a reference to the JavaScript file. The following is an example from the index.html file on your Monitor:
<!-- START Experience Manager Instrumentation Hooks -->
<script type="text/javascript" src="/HVReporting.js"></script>
<IFRAME src="about:blank" name="experiencemanager" width="0" height="0" align="top" frameborder="0" scrolling="no"></IFRAME>
<!-- END Experience Manager Instrumentation Hooks -->
12.1.2 Monitor Components
The Experience Manager Monitor is the core of the HVM framework. It is responsible for receiving and analyzing the raw performance data from thousands of browsers and generating meaningful metrics information and delivering those metrics to Operations Center.
All HVM components on the monitor are implemented with user-defined “HVM scripts” that define how data is collected and how collected data is reported to Operations Center. The scripting layer defines the “metrics” object that exposes the services and events needed by HVM scripts to perform these tasks.
The remainder of this section gives an overview of these components to help you understand how they fit together. Examples in the Script Reference section of this document, as well as the DemoMetrics configuration included in the Experience Manager Monitor installation, provide deeper insight.
Data Collection
When the monitor is ready to start processing HVM data, it fires the “metrics.onload” event. During its handling of this event, an HVM script should define a preprocessor object (see “metrics.createPreprocessor”) and one or more data-collector objects (see “metrics.creatSummaryCollector”), then deploy these objects using the “metrics.deploy” function. The configuration of these deployed objects determines how data is collected from the stream of events received from the instrumentation script running in end user browsers.
The preprocessor is composed of FieldFilter, FieldXForms (transformation rules), and rules for handling the received upload time. Using these value, the preprocessor scrubs each event record, normalizing data and filtering out any unwanted records. The monitor then uses the uploadTimeLimit value in the preprocessor to calculate the total response time for the event record.
Each event record that is not filtered out by the preprocessor is then evaluated be each deployed data collector. Data collectors collect information about the records received. In its smallest form, a data collector must define a name, an intervalDuration, and a function to which it delivers reports at the end of each interval. For example:
var collector = metrics.createSummaryCollector();
collector.name='example1';
collector.intervalDuration=60000;
collector.onreport=myReportHandler1;
As written, this example summary data collector calls myReportHandler1 once a minute (60000ms) and pass it a summary report, including the count and response time information (average, maximum and minimum values) for each event record received during that minute.
However, data collectors include several optional properties that allow for much richer data. For example, adding the following line to the example collector causes the collector to generate a separate report for each unique page title encountered during the reporting period:
collector.groupingFieldNames=[metrics.constants.FN_PAGE_TITLE];
Now, instead of generating a single report summarizing all the hits on an instrumented Web site, the data collector generates a separate report for each unique page title encountered during the interval. However, we might be using the HVM framework to collect information on more than one Web site, and those sites could have overlapping names. In that case, the groupingFieldNames property could be extended to include application name:
collector.groupingFieldNames=[metrics.constants.FN_APPLICATION_NAME,
                              metrics.constants.FN_PAGE_TITLE];
Now, assuming the instrumentation scripts on the two Web sites are configured with different application name values, the reports for those Web sites are properly segregated. Each unique combination of application name a page title produces a separate report.
In the examples above, groupingFieldNames were used to track metrics based on unique values sent from the instrumentation script. In some cases, the data from the instrumentation script does not provide the desired granularity. An example of this is a use case where data was tracked by browser type. The instrumentation script does not send browser type as one of the standard fields. It is however, possible to derive browser type from the user-agent field that is sent by the instrumentation script. To accomplish this, a set of FieldXForms in the preprocessor is needed to derive the browser type.
In the following snippet, FieldXform objects are created that identify Microsoft Internet Explorer and Mozilla Firefox browser types, the a collector is created to track hits by each of these types:
var iex = metrics.createFieldXform('IEX');
iex.fieldName=metrics.constants.FN_USER_AGENT;
iex.matchExpression='.*MSIE[^;]*.*';
iex.replaceExpression='Microsoft Internet Explorer';
iex.destFieldName='BrowserType';

var ffx = metrics.createFieldXform('FFX');
iex.fieldName=metrics.constants.FN_USER_AGENT;
iex.matchExpression='.*Firefox\S*.*';
iex.replaceExpression='Mozilla Firefox';
iex.destFieldName='BrowserType';

var preprocessor = metrics.createPreprocessor(3000, [iex,ffx],null);


var collector = metrics.createSummaryCollector();
collector.name='BrowseTypeCollector';
collector.intervalDuration=60000;
collector.onreport=myReportHandler2;


collector.groupingFieldNames=['BrowserType'];
metrics.start(preprocessor,[collector];
The HVM framework provides a broad, flexible set of tools to account for a variety of different Web site architectures. In the DemoMetrics example, provided with the Experience Manager Monitor installation, reports are generated by page, but in this case, Page Title is not assumed to be a valid way of distinguishing the page that was hit. In that case, the URL is passed through a FieldXform to determine the page that was hit, then a collector groups its reports based on those derived values.
Report Processing
At the end of each defined interval, a data collector calls their report handler functions and reports any activity it collected during that interval. If the data collector has grouping field names defined, then it delivers one report for each unique set of field values encountered during the interval.
The report handler extracts information from received reports and determines how the gathered information should be represented in the Operations Center element tree. Handlers can be very straightforward and simply map the reports directly into elements. For example:
function myReportHandler1(reports)
{
   for(var i=0; i < reports.length; i++)
   {
      var elem = metrics.createMetricsElement(reports[i], true);
      metrics.sendMetricsElement(elem);
   }
}
With very little script, this example captures virtually all of the data captured in the reports to Operations Center element. The element names reflect the name of the collector, as well as any grouping field values used to generate the report. The element properties reflect the current values collected, as well as details of the collector configuration, and the element is updated with series data containing the hit count and average, maximum, and minimum response times.
On the other hand, report handlers can be much more sophisticated. They can create and update any number of elements. It can add or update its own custom properties on those element, and it can store whatever series data is required with the element. There is no restriction as to how many elements can be created by a report handler, or how many report handlers can write to a given element. The only restriction is that for a given element, you might not write to the same series data name and time point more than once. So, for instance, in the report handler for the BrowserTypeCollector referenced above, we could just capture the percentage of hits on each browser and save that information as property and/or series data on an element that is also updated by another collector.
The report handler in DemoMetrics.js is much more sophisticated. It uses a number of page-specific configuration parameters to implement custom business rules. In that case, the condition of an element is driven by the percentage of hit within a predefined range to determine whether the page is performing at an appropriate level.
Configuration
An HVM implementation requires its own properties file and at least one script (.js) file. The name of the properties file is set in the “Metrics.properties” property in the monitor.properties file. For example, the default installation is configured as follows:
Metrics.properties=DemoMetrics.properties
The referenced properties file must identify the main script file of the HVM implementation and any configuration properties required by that script. It is recommended that HVM scripts not use the HVMetrics. prefix for its configuration properties. In a distributed data collection environment, it must also specify the HVM group properties (see Section 12.1.4, Grouping Monitors for distributed HVM data collection).
Errors in either the properties file or the HVM script file causes the monitor to halt.
12.1.3 Operations Center Data Repository
The Experience Manager Monitor delivers metrics element data to any Experience Manager adapter managing the monitor. (It also caches data for unreachable adapters per the events.log feature.) Upon receiving element data from a monitor, the adapter adds or updates an element with a hierarchy matching the MetricsElement.elementKeys under the Metrics branch of the adapter’s element hierarchy.
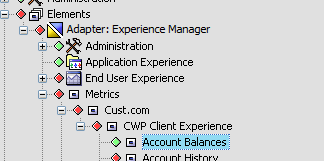
The highlighted element in the hierarchy shown in Figure 12-1 was created with a MetricsElement with element keys ['Cust.com', 'CWP Client Experience', 'Account Balances'].
Figure 12-1 Adapter Hierarchy

It is not necessary to explicitly create parent elements in the hierarchy.
Metrics Elements are purely a reflection of the data written to them from the HVM script. Adapter properties and operations on these elements are provided to allow clean up of unwanted data. Otherwise the element content is entirely driven by the HVM script.
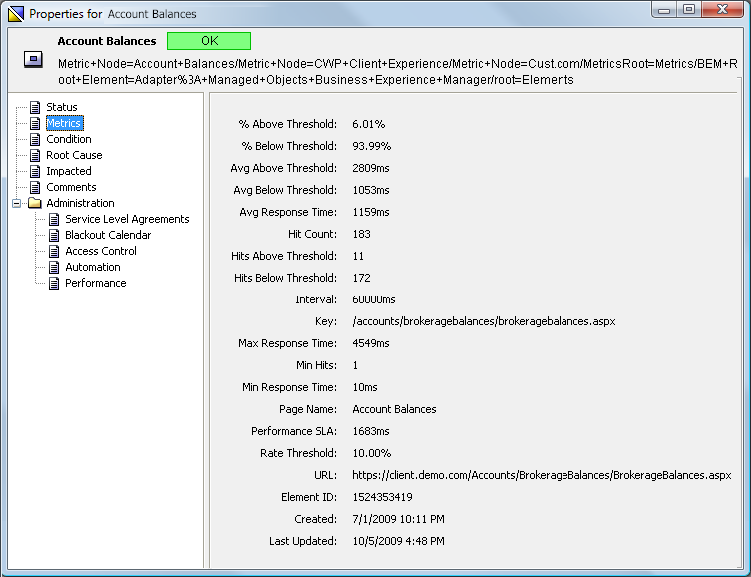
Element properties defined by the HVM Script are exposed on the properties page for the element:
Figure 12-2 Properties Page: Account Balances

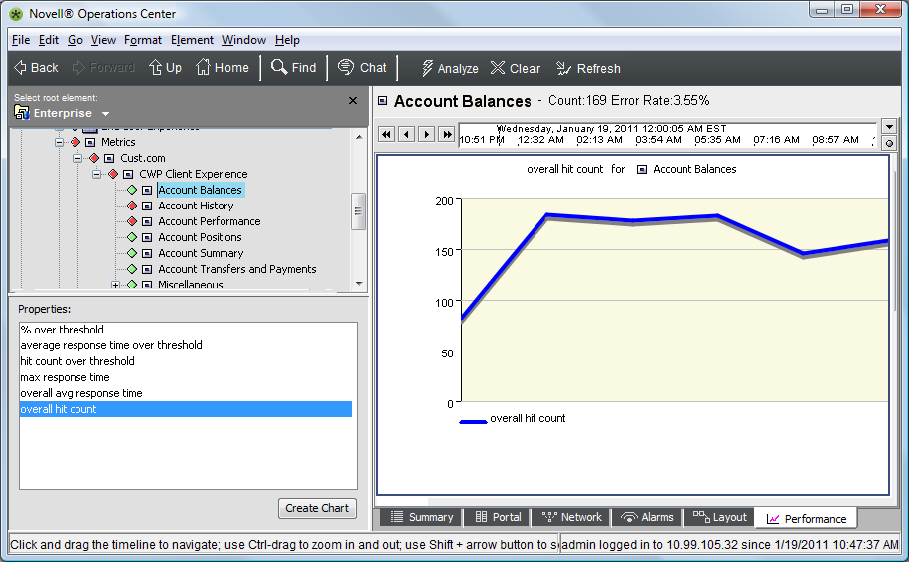
Series data attached to the element is exposed in the Performance view:
Figure 12-3 Performance Tab

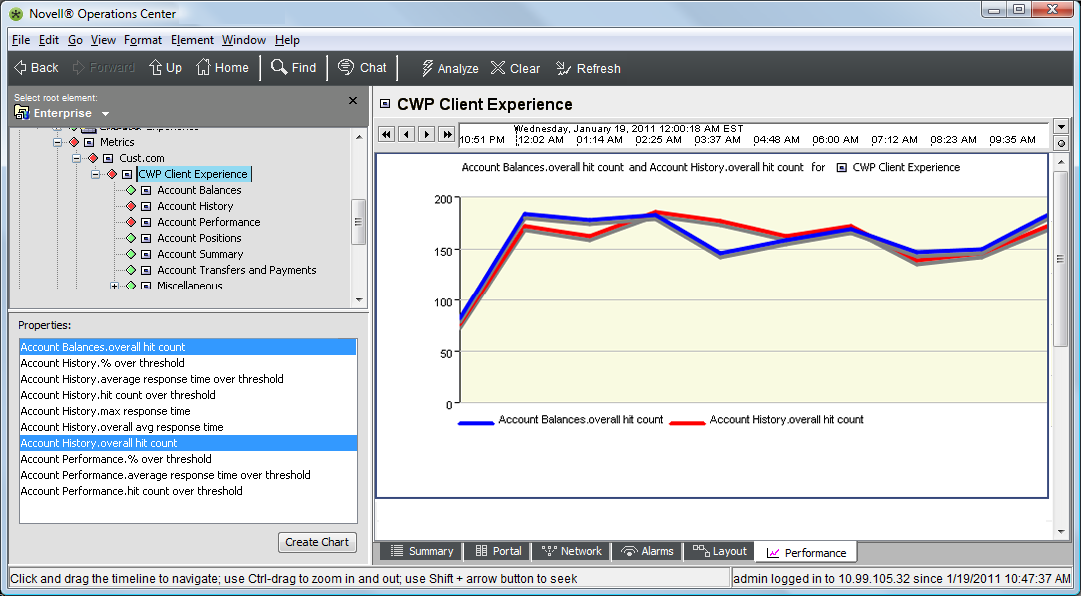
Performance data of children is exposed up the element hierarchy, making it easier to compare data across elements:
Figure 12-4 Performance Data

12.1.4 Grouping Monitors for distributed HVM data collection
When monitoring a Web site that has very high volume (greater than 20k hits/minute) it is possible to configure multiple Experience Manager monitors to act in concert to collect and process event records from end user systems. In this configuration, all monitors in the group typically sit behind a load balancer that distributes incoming event records among the available monitors. The load balancing functionality, virtual IP address, and so on are external to the Experience Manager product.
When acting as a group, one monitor assumes the role of group controller and all others act as slaves to the controller. The controller has the responsibility of distributing information about deployed preprocessor and data collector objects to the members of the group, collecting reports from the group members at the end of each reporting interval and merging the reports into a single set of reports representing the data collected by all members of the group. Slave monitors in an HVM group typically keep their Web servers shut off until they receive deployment instructions from the controller monitor (see Metrics.manageWebServer in monitor.properties).
Setting up a group of monitors is driven from the HVM properties file and requires little or no change to the HVM script. The controller acts very much like a monitor collecting HVM data in the stand alone mode. When it is ready to start the HVM feature, it calls the metrics.onload event handler in its local environment, and waits for the handler to deploy a preprocessor and a set of data collectors. At that point the controller updates the local environment and sends copies of the configured preprocessor and data collectors to all other group members. Each group member then begins to collect and process event records from end user browsers using this shared deployment. At the end of each reporting interval, the controller collects reports from the local environment, as well as all group members. The data in these reports is then merged into a single set of reports representing the data collected by the entire group. These reports are then passed to the onreport handler for the data collector just as they are in a stand alone environment.
It is vital that all members of an HVM group work from the same group configuration. Group configuration properties are designed such that the same properties file can be used, without modification by all members of the group. (Either copies of the same properties file, or a common file accessed on a network share.)
A complete set of HVM group properties are included at the bottom of the included DemoMetrics.properties file. The most important properties are described here:
-
HVMetrics.group.controllers: Ordered list of monitors that could act as controller in a group. Monitors are specified in monitor_name:monitor_port format (such as devtower18.mosol.com:6789) Members of the list are separated by commas. The first entry in the list is always the group controller, unless that monitor is not running. Any later members only assume control of the group if they time out, waiting for control by a higher precedence controller.
-
HVMetrics.controller.protomotionTimeout: Specifies the amount of time (in ms) that a backup controller waits for connectivity with a higher-precedence controller before assume the active controller role. If multiple backup controllers are specified, then this timeout must expire for each of the higher-precedence controllers before activating.
-
HVMetrics.group.members: Comma-separated list of all monitors in this group (in the same format described for controllers).
12.1.5 Testing Tools
The /eventPump directory in the Experience Manager monitor installation contains a test tool that can be used to generate simulated event records and send them to a Experience Manager monitor. The event pump tool is driven by a properties file that identifies the monitor to which events should be sent, the frequency with which they should be sent, and the range of values that should be used in generating events. To use the eventPump tool, configure a properties file with the desired information using the provided sample as a template and entire the following command:
java -jar eventpump.jar properties_filename
The eventPump tool is not dependent on the monitor installation structure. You can copy the JAR and properties files to any system with an appropriate JRE and you can run as many concurrent instances as you wish.