8.2 Configuring Web Application to Measure Response Times
Monitored Web pages must include specific code for each Experience Manager Monitor that tracks them. First you must export an instrumentation file, and then add a minor code snippet to each page you wish to monitor.
To instrument a Web Application to monitor Web page response times:
-
Do the following to generate a JavaScript instrumentation file for each Experience Manager monitor being use to collect data for the Web application:
-
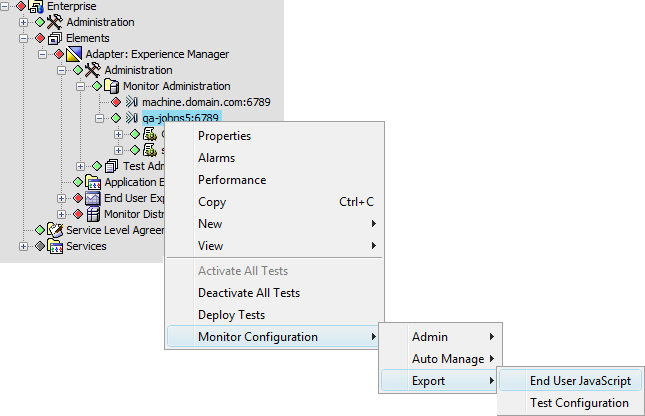
In the Explorer pane, right-click the desired monitor, and select > > .
-
Type an application name for the Web application in the field.
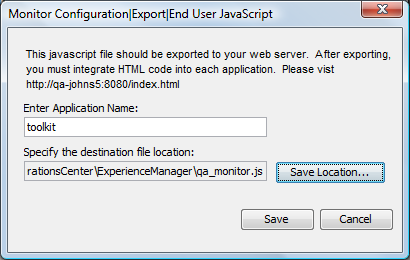
This name is used for the generated element (when data is available) in the Operations Center hierarchy under > .
-
(Optional) Click the button to specify a destination file that includes a destination address and file name for the exported JavaScript code.
Perform this step only if users access the instrumented Web page via a proxy server or run a NAT server. If using proxy or NAT servers, the reported client IP might reflect the server’s IP address, not necessarily that of the end user’s browser.
-
(Optional) Customize the exported JavaScript file.
For information on customizing the file, see Section 8.3, Customizing the Instrumentation Script.
-
-
Using a Web browser, go to the following URL to verify the server is running and Operations Center can receive data:
http://monitor-hostname:port/index.html
Where, monitor-hostname is the name of the device where the monitor is running, and port is the port defined for the monitor’s Web server.
-
Cut and paste the following sample code (with the appropriate modifications) into the target HTML page or template between the <head> and </head> tags:
<script type="text/javascript" src="JavaScript_File"></script>
<IFRAME src="about:blank" name="experiencemanager" width="0" height="0" align="top" frameborder="0" scrolling="no"></IFRAME>
Where, JavaScript_File is the name and location of the exported file from Step 1.
-
Embed this code in each Web-based application that Experience Manager tracks. The location of the embedded code is called an instrumentation point.
-
The number of files in which to embed the code varies. Using Header templates can reduce the number of instrumentation points across a Web-based application.
-
Look for a consistent Header or other HTML utility text that exists on every Web page. There can be only one instrumentation point for an entire application.
-
This code can also be embedded by using frames. Locate the outermost frame for the best results.
-