9.1 Reviewing Test Alarms and Performance Data
You gain valuable information from reviewing test events and test record properties. Critical alarms flag problem tests and displays details on the alarm property pages. Test events display as alarms in the Alarms view in the Operations Center console.
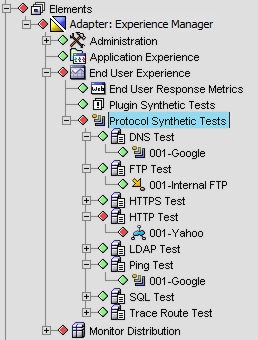
All test elements display in the Explorer pane, under the End User Experience element and the associated test type.
9.1.1 Viewing Test Results
To view test results:
-
In the Explorer pane, expand the root element > Experience Manager Adapter > > , then select a hostname.
-
Select a test name.
-
In the View pane, click the tab and the Alarms view is updated:

The severity and response times for each test display in the Alarms view. The Aggregate element displays the combined response time for all the tests. It also has a class of ROLLUP.
For more information on using the Alarms view, see Filtering and Managing Alarms in the Operations Center 5.6 User Guide.
-
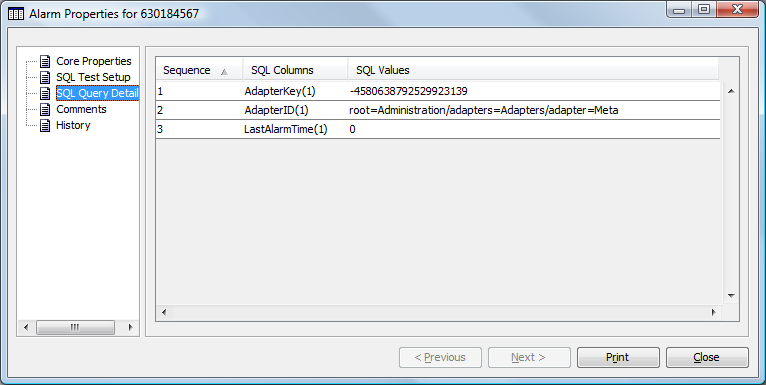
To view the alarm properties for a synthetic test, right-click an alarm in the Alarms view, then click to open the Status property page.
The named property pages vary depending on the test type.
Test Type
Property Page
Information Provided
All Synthetic Tests
Core Properties
The event type (synAlarm is synthetic alarm), the affected element, and other key information about the test performed, including actual, average, low and high response times.
Synthetic Testing Metrics
The scenario name, synthetic test type, and target and test details.
E‑Mail
Core Properties
Subdivides the response time into send and receive time.
HTTP
When there is a content match failure, custom alarm tabs display raw source code for the HTML response. These tabs vary depending upon the HTML response.
HTTP Assets
A list of all images downloaded from the Web page and the amount of time taken to download. If a specific asset fails to download, it is noted and the event has a severity of MINOR.
Certificate
If applicable, displays various certificate information including Issuer DN, Subject DN, Version, Algorithm Name, Expiration Date, and Serial Number.
SQL
Core Properties
Login time and query time.
Trace Route
Hops
A list of all hops made to access the specified host.
Understanding Alarm Status
When a HTTP/HTTPS scenario fails to retrieve an image, the event does not send a CRITICAL event. It continues processing and identifies the failed image in the alarm’s tab. The sent event has a MINOR severity in Operations Center.
In the alarm Core Properties property page, the Description text area includes the message One or more of the assets had errors, see asset list. The Application Name text box displays a message similar to test image failure lab1.acme.com.
The HTTP Assets tab displays “failed” in the column, next to the affected image:
Figure 9-1 Response Times Column Displaying the Failed Message
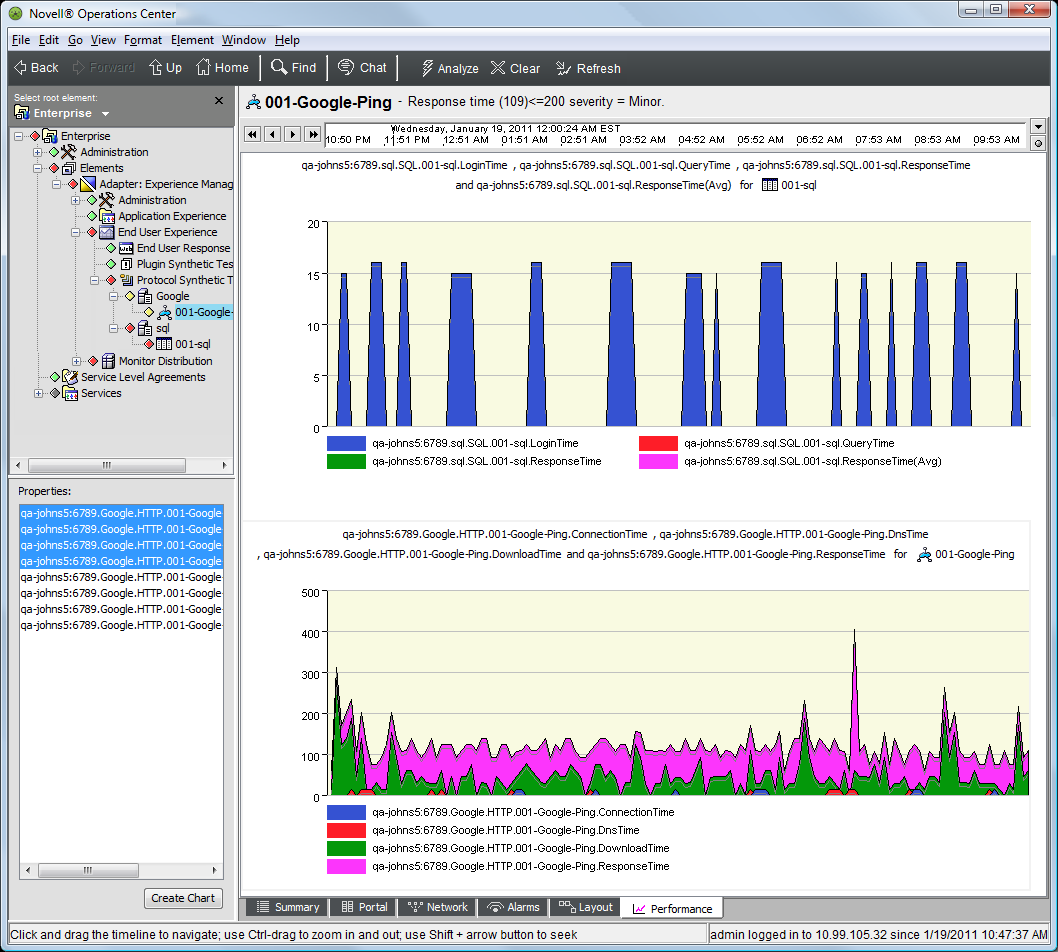
9.1.2 Charting Data in the Performance View
It is useful to graph the data received for some of the Experience Manager Monitor’s tests. Graphical information can effectively present statistics for response time over a period of time.
In Operations Center, use the Performance view to chart the following metrics available for a synthetic test:
-
Connection Time: The elapsed time required to establish a connection (overlaps DNS time).
-
DNS Time: The elapsed time required to complete the name resolution.
-
Download Time: The elapsed time between starting the (HTTP) response and fully reading the response.
-
Response Times (Avg, High, and Low): The elapsed time required to complete a full download.
-
SSL Handshake Time: The elapsed time required to establish a SSL handshake.
-
Transaction Time: The elapsed time between starting and responding to the start.
To compare response times over a time period, use the Performance view charting features. The line charts on the following page show response times for three different Web pages every 10 minutes over a one-hour period.
For additional information about using the Performance view, see Charting Performance Data in the Operations Center 5.6 User Guide.
To chart test data:
-
In the Operations Center console, click the tab.
The Performance view updates.
-
In the Explorer pane, expand > Experience Manager Adapter > > .
-
Select a test/scenario element.
Associated chart properties display in the Properties panel.
-
Select a property, then click the button.
A chart displays in the Performance view: