4.6 Viewing Events Per Second Statistics
4.6.1 Viewing Graphical Representation of Events Per Second Value
-
Log in to Sentinel Log Manager as an administrator.
-
Click the link in the upper left corner of the page.
-
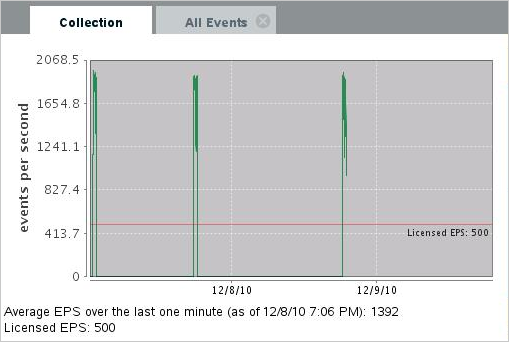
In the section, you can view the events per second (eps) value of the incoming events in the last one minute.
The graph shows the last 90 day statistics of all the events coming to the Sentinel Log Manager server. The graph also includes a EPS indicator that enables you to determine whether the current EPS rate is exceeding the licensed EPS rate or is close to the licensed EPS rate.
4.6.2 Viewing Events Per Second Value of Event Source Servers
-
Log in to the Sentinel Log Manager as an administrator.
-
Click the link in the upper left corner of the page.
-
Click the tab.
The Event Sources page is displayed.
-
The column of the section specifies the events per second value received from all the event source servers.