4.5 Managing Event Sources
The event sources interface displays the health of the event source and the volume of data being received from it in events per second. The Event Sources page lists all the event sources, such as Syslog, Audit, File, and Database, that are configured in the Event Source Management interface.
You can refine the displayed event sources by selecting Collector Managers, Event Source Servers, and Collector Plug-ins. You can also specify a filter on the event source name and select particular event source health states you want to view. All of these selections and filters are stored on a per-user basis, so that each time you login to Sentinel Log Manager server you can view event sources that match your last selections.You can also perform filtering based on tags. For more information, see Section 8.7, Searching Tagged Events.
This section has the following information:
4.5.1 Viewing the Event Sources Page
The Event Sources page consists of different sections as shown in Figure 4-1.
Figure 4-1 Event Sources Page
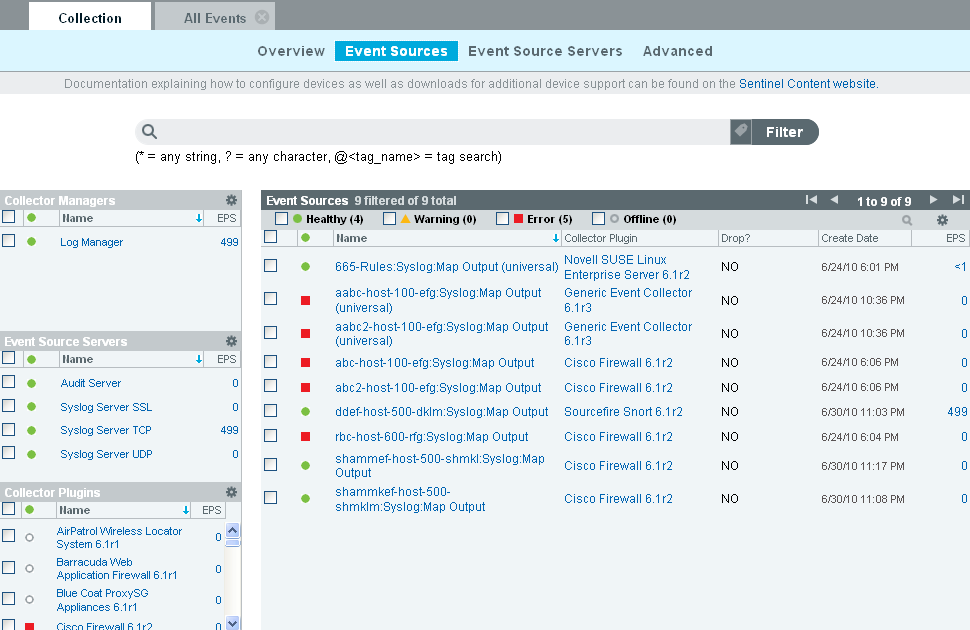
Collector Managers: Lists all the Collector Managers associated with the Sentinel Log Manager system.
Event Source Servers: Lists all the event source servers associated with the Sentinel Log Manager system.
Collector Plugins: Lists all the Collector plug-ins associated with the Sentinel Log Manager system.
The Event Sources section in the right pane lists the event sources based on the options selected from the left pane.
NOTE:The Event Sources page shows event sources that were already configured or automatically detected. To manually configure additional event sources, use the Event Source Management user interface described in Configuring Data Collection for Other Event Sources.
This section has the following information:
Viewing Event Sources
-
Log in to Sentinel Log Manager as an administrator.
-
Select .
The Event Sources page is displayed.
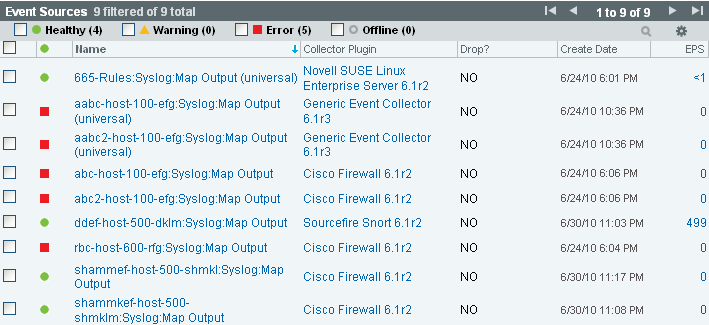
The following table explains each column of the event source section:
Columns
Description
Health Icon
The colored icon indicates the event source health.
Green: Indicates that the event source is healthy and Sentinel Log Manager has received data from it.
Red: Indicates that the Sentinel Log Manager server is reporting an error about connecting to or receiving data from this event source.
Gray: Indicates that the event source is turned off. Sentinel Log Manager is not processing any data from it.
Orange: Indicates that the event source is running with some warnings.
You can sort the event sources based on their health status.
Name
The event source name is the name given to the event source by the system (if it was auto-created) or by a user. For syslog event sources, if the event source was auto-created by the system, the name is a combination of the hostname/IP address and the Collector connection mode the event source is using.
You can rename any event source at any time through the Event Source management interface.
You can sort the event sources in alphabetical order based on their names.
Collector Plugin
Specifies the name of the Collector plug-in that the event source is connected to.
NOTE:This is the name of the Collector plug-in, not the name of the Collector instance.
You can sort the event sources based on Collector plug-in name.
Drop
Specifies whether data from the associated event source should be dropped or not.
YES: If is set to YES, all data received from the event source is dropped. This means that the raw data is not saved and events are not generated.
NO: If is set to NO, all raw data from the event source is saved and events are generated. When it is set to NO, raw data is always saved, regardless of whether a filter is set on the event source using the Event Source Management user interface. However, if a filter is set, events might not be generated if the filter causes the data to be ignored.
You can sort the event sources based on the drop data status.
Create Date
Specifies the date and time when the event source was created.
You can sort the event sources based on when they were created.
EPS
Specifies the events per second value received from the event source. You can sort the event sources based on their events per second value.
NOTE:If you see a value of less than one (<1) in this column, it indicates that the EPS rate is greater than zero, but less than one.
-
To select or deselect the event sources, select the check boxes next to the respective event source.
To select all the available event sources, select the check box at the top of the column.
-
To sort the event sources by , , , , , and values, click the respective column header. The selected column header is displayed in bold.
When you first click the column header, the event sources are arranged in the ascending order. A blue down-arrow is displayed to indicate that the sort order is ascending. When you click the column header for the second time, the sort order is changed to descending, and a blue up-arrow is displayed to indicate that the sort order is descending.
-
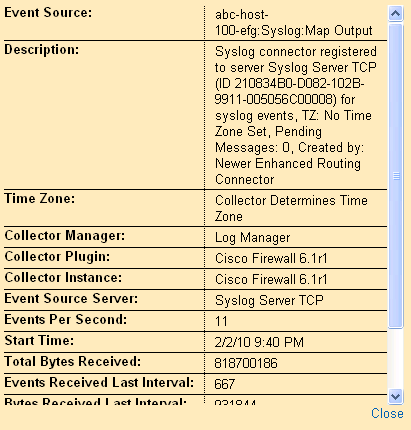
To view additional information about an event source, click the or value of an event source.A dialog box is displayed with the additional information.
Viewing Collector Managers
-
Log in to Sentinel Log Manager as administrator.
-
Select .
The Collector Manager section is displayed in the Event Sources page with the following details:
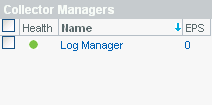
Health: Indicates the health of the Collector Managers. You can sort the Collector Managers based on their health status.
Name: Displays the name of the Collector Managers. You can sort the Collector Managers in alphabetical order based on their names.
EPS: Displays the events per second value received from the event sources. You can sort the Collector Manager based on the events per second value.
-
To select or deselect the Collector Managers, select the check boxes next to the respective Collector Manager.
To select all the available Collector Managers, select the check box located at the top of the column.
The right pane displays the list of event sources connected to the selected Collector Managers.
If none of the Collector Managers are selected, the event sources table displays all the configured event sources.
-
To sort the Collector Managers by , , and values, click the respective column header. When you click the column header the respective column header displays in bold text.
-
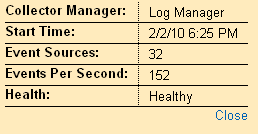
To get additional information about the Collector Managers, click the or value column, a dialog box is displayed with the additional information.
Viewing Event Source Servers
-
Log in to the Sentinel Log Manager server as administrator.
-
Select .
The Event Source Servers section is displayed as follows:
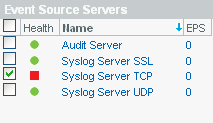
Health: Indicates the health of the event source server. You can sort the event source servers based on their health status.
Name: Displays the names of the event source server used to parse the data from the event sources (for example, syslog Server SSL). You can sort the event source server in alphabetical order based on their names.
EPS: Displays the events per second value received from the event sources. You can sort the event source servers based on the events per second value.
-
To sort the event source servers by , , and values, click the respective column header. The selected column header displays in bold text.
-
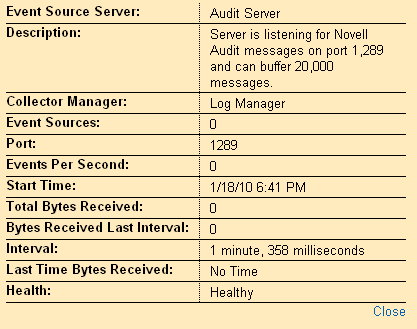
To view additional details, click the or value column. A dialog box is displayed with the additional information.
Viewing Collector Plug-ins
-
Log in to the Sentinel Log Manager server as administrator.
-
Select
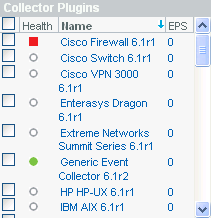
Health: Indicates the aggregate health of all event sources that are connected to the Collector plug-in.
With the exception of the green icon (healthy state), the icon does not necessarily mean that all event sources connected to the Collector plug-in are in state indicated by the icon.
The red icon (error state) indicates that one or more event sources connected to the Collector plug-in are in an error state. To get a detailed information, click the or column value to view help information.
Name: Displays the names of the Collector plug-in used to parse the data from the event sources (for example, Cisco Firewall 6.1r1). You can sort the Collector plug-ins in alphabetical order based on their names. This lists all the configured Collector plug-ins and not the Collector instances.
EPS: Displays the events per second value received from the event sources. You can sort the Collector based on the events per second value.
-
To select or deselect the Collector plug-ins, select the check boxes next to the respective Collector plug-in.
To select all the available Collector plug-ins, select the check box at the top of the column.
-
To sort the Collector plug-ins by or values, click the appropriate column header. When you click the column header the respective column header displays in bold text.
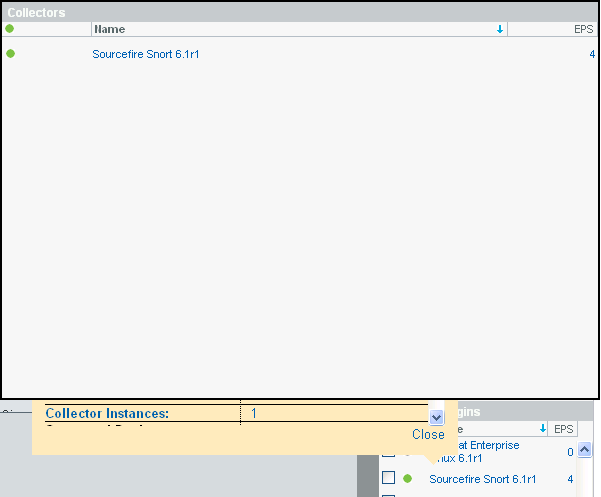
The field displays the number of instances of the Collector plug-in. Clicking on the field displays a window with a list of Collector instances associated with the Collector plug-in.
-
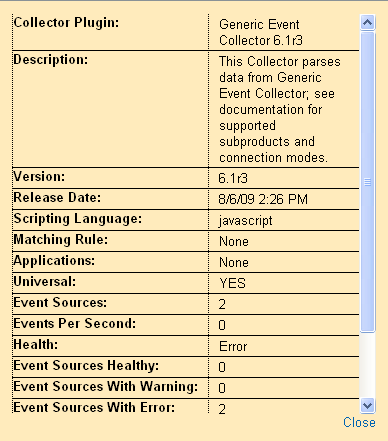
When you click the column, a dialog box is displayed with additional information about the Collector plug-in.
4.5.2 Filtering Event Sources
-
Log in to the Sentinel Log Manager server as an administrator.
-
Select .
-
To filter the event sources by name, type a name value in the filter text box, then click .
Matching is case insensitive. The name value can contain wildcard characters. Use * to match zero or more characters and use ? to match one character. If no wildcard characters are specified in the name value, it is assumed that the name value is intended to mean contains <name value>, or *<name value>*.
For example, an event source value of abc is interpreted as *abc*. Some examples of common filter types are:
-
If the event source name starts with abc, enter the filter value as abc*.
-
If the event source name ends with abc enter the filter value as *abc.
-
If the event source name contains abc enter the filter value as abc or *abc*.

The event source table displays the list of event sources whose name matches the value entered in the filter input box.
-
-
To filter event sources based on tags, do one of the following:
-
Click
 , then select the tags from the dialog box, based on which to search the events.
-
Specify the following search criteria:
@<tag_name>
For example, @HIPAA displays all events tagged with HIPPA tag.
-
-
To view the event sources based on the health status, select the , , , or check boxes.

The Event source table displays the list of event sources with the selected health states.
If none of the health states are selected, health state filtering is not performed. It is essentially equivalent to selecting all four health states.
-
In the Event Source section, click the , , , and arrow links to scroll through all the event sources.
The Event Source section displays 30 event sources per page.
-
To view the event search result for an event source, select the event source from the list and click the icon.
A search is performed using the universally unique identifier (UUID) of the event source (for example, rv24:"2CBFB8A0-F24B-102C-A498-000C").
If multiple event sources are selected for search, the rv24:<UUID> expressions are combined with the OR operator in the search filter expression.
-
To display the event sources connected to particular Collector Managers, select one or more Collector Managers from the Collector Managers section.
If none of the Collector Managers are selected, event sources refinement is not performed based on the Collector Managers. This is not the same as selecting all Collector Managers, because it also includes event sources that are not connected to any Collector Manager.
To select or deselect the event source servers, select the check boxes next to the respective event source server.
-
To display only event sources connected to particular event source servers, select one or more event source servers from the Event Source Servers section.
If none of the event source servers are selected, event sources refinement is not performed based on the event source servers. This is not the same as selecting all event source servers, because it also includes event sources that are not connected to any event source server.
To select or deselect the event source servers, select the check boxes next to the respective event source server.
-
To display only those event sources connected to particular Collector plug-ins, select one or more Collector plug-ins from the section.
If none of the Collector plug-ins are selected, event sources refinement is not performed based on the Collector plug-in. It is essentially equivalent to selecting all of the Collector plug-ins.
4.5.3 Changing the Data Logging Status of Event Sources
-
Log in to Sentinel Log Manager as administrator.
-
Select
-
To change the data logging status for one or more event sources, select the event sources from the list.
-
Click , then select either or option,
Drop Data: If is selected, the selected event sources drop all the events received. Messages are not sent to the Collectors the selected event sources are connected to.
Allow Data: If is selected, the selected event sources forward events received to the Collectors they are connected to.
NOTE:If you select a large number of event sources to change, it may take a while to complete. The event sources list does not show the Drop state ( or ) until after the changes are complete, and the display is refreshed from the database.
4.5.4 Changing the Associated Collector Plug-in for Event Sources
-
Log in to Sentinel Log Manager as an Administrator.
-
Select
-
Select the event sources from the list, then click .
-
Select the option.
The Set Collector Plugin window is displayed with the and information.
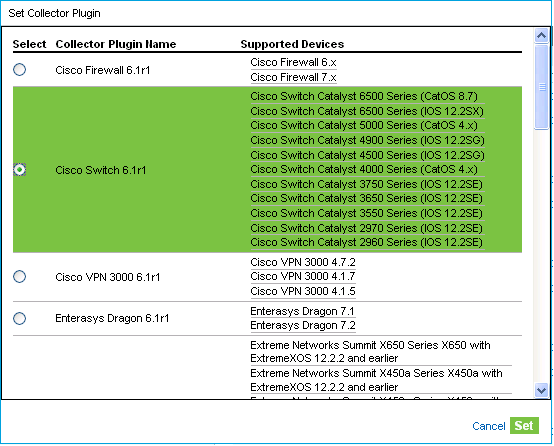
-
Select a new Collector plug-in, then click .
The event sources are connected to the selected Collector plug-in.
NOTE:If you select a large number of event sources to change, it may take a while to complete. The event sources list does not show the new Collector plug-in until after the changes are complete, and the display is refreshed from the database.
4.5.5 Changing the Time Zone Setting for Event Sources
-
Log in to the Sentinel Log Manager server as Administrator.
-
Select
-
To change the time zone setting for one or more event sources, select the event sources from the list, click the link, and select the option.
The window is displayed.
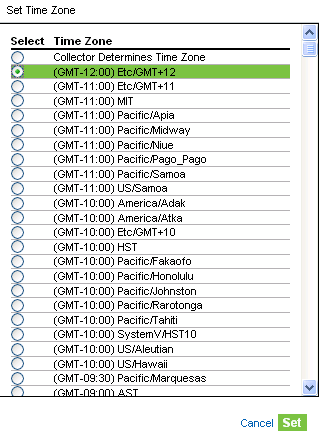
-
Select a new time zone, then click .
The selected event sources are set to the new time zone setting.
NOTE:If you select a large number of event sources to change, it may take a while to complete. The event sources list does not show the new time zone until after the changes are complete, and the display is refreshed from the database.
4.5.6 Starting and Stopping Event Sources by Using the Script
You can start or stop event sources by using the ./esm_manager.sh script in the console.
-
Log in to the console as the novell user.
-
Change to the /opt/novell/sentinel_log_mgr/bin directory.
-
(Conditional) To start an event source, specify the command as follows:
./esm_manager.sh <event_source_ID> start -
(Conditional) To stop an event source, specify the command as follows:
./esm_manager.sh <event_source_ID> stop