5.3 Viewing Search Results
Searches return a set of events. You can view the search results in the basic view or in the advanced view.
When results are sorted by relevance, only the top 50,000 events can be viewed. When they are sorted by time, all the events in the system are displayed.
5.3.1 Basic Event View
The information in each event is grouped into General Event information, Initiator information, Target information, Observer Information, Reporter information, and Customer values and retention policy information. If the Collector that processed the raw data could not find the information for a particular event field, information for that field is not displayed or is labeled as .
To view the raw data information:
-
Launch the Event Source Management (Live View) window.
-
Select the option to display the window.
You can view the detailed information in the section. If you do not see the information, check to see if you need to reconfigure the system to send the syslog data to include the missing information
If the Collector parsing logic could not parse the existing raw data, the fields might not be displayed or might be labeled . To fix this, the Collector parsing logic needs to be enhanced.
Occasionally, the search engine might index events faster than they are inserted into the data directory. If you run a search that returns events that were not inserted into the data directory, you get a message indicating that some events match the search query, but they are not found in the data directory. If you run the search again later, the events are in the data directory and the search is shown as successful.
5.3.2 Event View with Details
-
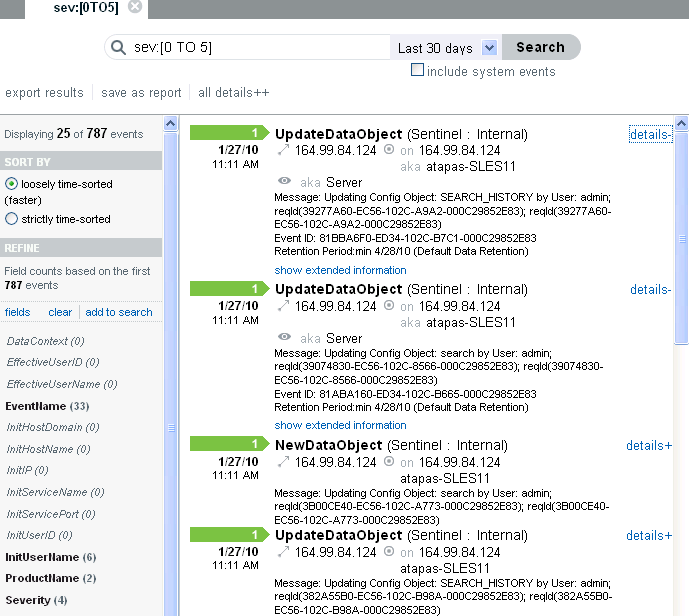
To view the details about all the events, click the link at the top of the search results page.
You can expand or collapse the details for all events on a page by using the orlink.
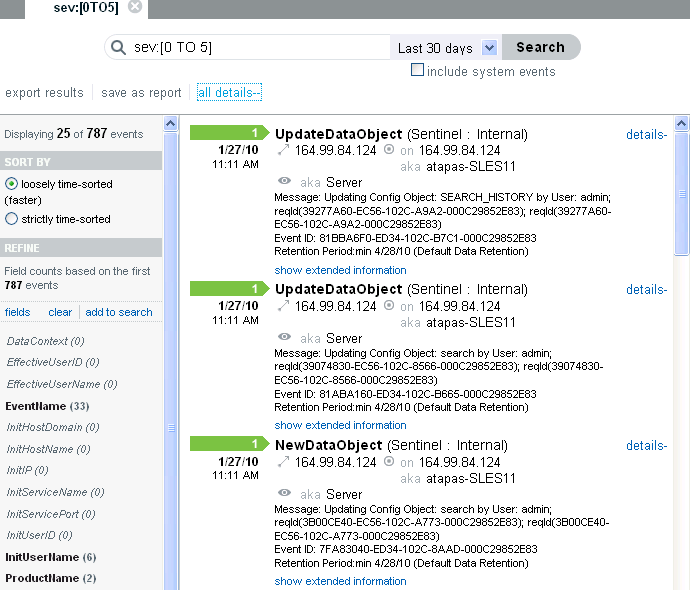
-
To view details about any individual event, click the link at the right side of the page.
You can expand or collapse the details for all events on a page by using the orlink.
For example, you can display the Message, Event ID, and default data retention duration information for the events.
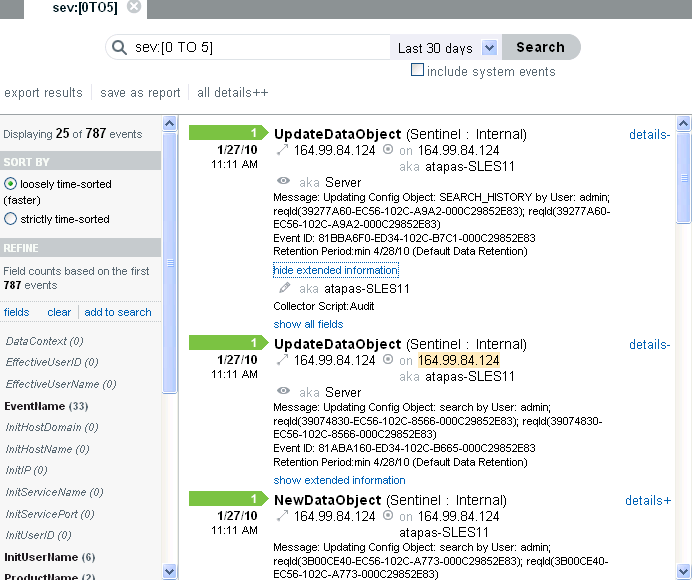
-
Click the link to view additional details of the events.
You can expand or collapse this information by using the or links.
For example, it displays the Source IP address, Rawdata Record ID, Collector Script, Collector name, Collector Manager ID, Connector ID, and Event Source ID information for the incoming events.
-
Rawdata Record ID: Displays the raw data record ID and provides information about the raw data record that initiated the event.
-
Collector Script: Displays the name of the collector script. When you click the field value, the value is added to the current search and provides information about other events parsed by the same collector script.
-
Collector name: Displays the name of the collector. When you click the field value, the value is added to the current search and provides information about other events parsed by the same instance of the collector.
-
Collector Manager ID: Displays the name of the Collector Manager. When you click the field value, the value is added to the current search and provides information about other events coming from the same Collector Manager.
-
Connector ID: Displays the name of the connector. When you click the field value, the value is added to the current search and provides information about other events coming from the same Connector node.
-
Event Source ID: Displays the name of the Collector Manager. When you click the field value, the value is added to the current search and provides information about other events coming from the same Event Source.
If the Collector, Collector Manager, Connector, and EventSource plug-in instances are deleted, then the IDs are displayed instead of the names.
-
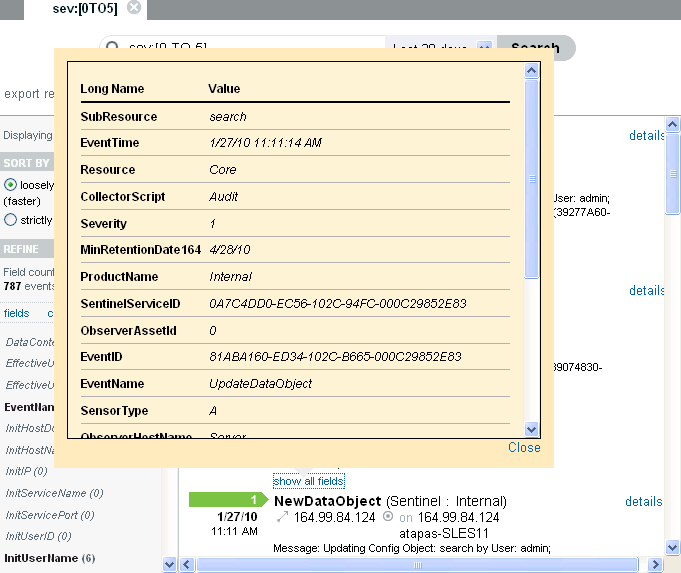
-
Click the link to view information about all associated fields for the particular event.
The list shows only the event fields that have values.
-
Click the link to open a new tab with event source hierarchy and event source fields populated, based on the information received from the event.
If the search result is a system or an internal event, the link does not appear.
To verify and download the raw data files, see Section 3.5, Verifying and Downloading Raw Data Files.
