4.4 Viewing Access Gateway Statistics
The Statistics page allows you to monitor the amount of data and the type of data the Access Gateway is processing.
-
In the Administration Console, click > > > .
-
Select from the following types:
-
Click .
4.4.1 Server Activity Statistics
Select whether to monitor live or static statistics:
Statistics: Select this option to view the statistics as currently gathered. The page is static and the statistics are not updated until you click .
Live Statistics Monitoring: Select this option to view the statistics as currently gathered and to have them refreshed at the rate specified in the field.
These general statistics are grouped into the following categories:
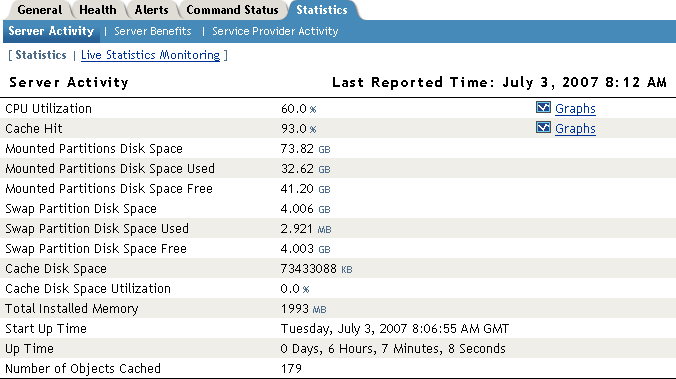
Server Activity
The Server Activity section displays general server utilization statistics.
|
Statistic |
Description |
|---|---|
|
CPU Utilization |
Displays the current CPU utilization rate. Use the available graph for capacity planning. Click to view the CPU usage for a specific unit of time (1 hour, 1 day, 1 week, 1 month, 6 months, or 12 months). The Value axis displays the percentage of use. |
|
Cache Hit |
(Access Gateway Appliance) Displays the current cache hit rate. A high cache hit rate indicates that the caching system is off-loading significant request processing from the Web servers whose objects have been cached. Click to view the number of cache hits for a specific unit of time (1 hour, 1 day, 1 week, 1 month, 6 months, or 12 months). The Value axis displays the number of hits. |
|
Mounted Partitions Disk Space |
(Access Gateway Appliance) Displays the total disk space configured on mounted partitions. |
|
Mounted Partitions Disk Space Used |
(Access Gateway Appliance) Displays the disk space in use on mounted partitions. |
|
Mounted Partitions Disk Space Free |
(Access Gateway Appliance) Displays the disk space available on mounted partitions. |
|
Swap Partition Disk Space |
The Gateway Appliance and the Windows Gateway Service display the total disk space configured for the swap partition. The Linux Gateway Service displays the available swap space reported by the Linux kernel (see sysinfo for details). |
|
Swap Partition Disk Space Used |
(Linux) Displays the disk space in use on the swap partition. |
|
Swap Partition Disk Space Free |
(Linux) Displays the disk space available on the swap partition. |
|
Cache Disk Space |
Displays the total disk space available for caching. |
|
Cache Disk Space Utilization |
Reserved. Not currently used. |
|
Total Installed Memory |
Displays the amount of memory that is installed on the Access Gateway. |
|
Start Up Time |
Displays the last time the Access Gateway was started. |
|
Up Time |
Displays the total time the Access Gateway has been running since it was last started. |
|
Number of Objects Cached |
Displays the total number of objects that have been cached since the Access Gateway was last started. |
Connections
The connection statistics show the current and peak levels of usage in terms of TCP connections. Only the Access Gateway Appliance gathers these statistics.
|
Statistic |
Description |
|---|---|
|
Current Connections to Origin Server |
Displays the current number of connections that the Access Gateway has established with Web servers. |
|
Current Connections to Browsers |
Displays the current number of connections that the Access Gateway has established with browsers. |
|
Current Total Connections |
Displays the current total of all connections that the Access Gateway has established. |
|
Connections to Origin Server |
Displays the total number of connections that the Access Gateway has established with Web servers since it was last started. Click to view the number of connections for a specific unit of time (1 hour, 1 day, 1 week, 1 month, 6 months, or 12 months). The Value axis displays the number of connections. |
|
Peak Connections from Origin Server |
Displays the peak number of connections that the Access Gateway has established with Web servers. |
|
Connections to Browsers |
Displays the total number of connections that the Access Gateway has established with browsers since it was last started. Click to view the number of connections for a specific unit of time (1 hour, 1 day, 1 week, 1 month, 6 months, or 12 months). The Value axis displays the number of connections. |
|
Peak Connections to Browsers |
Displays the peak number of connections that the Access Gateway has established with browsers. |
|
Total Connections through SOCKS |
Displays the total number of connections the Access Gateway has established through a firewall. |
|
Failed Connection Attempts |
Displays the total number of failed connection attempts the Access Gateway has made while attempting to fill its Web object cache. |
Bytes
The bytes statistics show how fast information is being sent in response to the following types of requests:
-
Browser requests to the Access Gateway
-
Access Gateway requests to the Web servers
|
Statistic |
Description |
|---|---|
|
Bytes per Second from Origin Server |
(Access Gateway Appliance) Displays the number of bytes of data being sent each second from the Web servers to the Access Gateway. Click to view the number of bytes for a specific unit of time (1 hour, 1 day, 1 week, 1 month, 6 months, or 12 months). The Value axis displays the number of bytes. |
|
Bytes per Second to Browsers |
(Access Gateway Appliance) Displays the number of bytes of data being sent each second from the Access Gateway to the browsers. Click to view the number of bytes for a specific unit of time (1 hour, 1 day, 1 week, 1 month, 6 months, or 12 months). The Value axis displays the number of bytes. |
|
Total Bytes per Second |
(Access Gateway Appliance) Displays the total number of bytes of data being sent each second from the Access Gateway and from the Web servers. Click to view the number of bytes for a specific unit of time (1 hour, 1 day, 1 week, 1 month, 6 months, or 12 months). The Value axis displays the number of bytes. |
|
Bytes Received from Origin Server |
(Access Gateway Appliance) Displays the total number of bytes of data sent to the Access Gateway from the Web servers since the Access Gateway last started. |
|
Bytes Sent to Browser |
Displays the total number of bytes of data sent to the browsers from the Access Gateway since the Access Gateway last started. |
|
Total Bytes |
(Access Gateway Appliance) Displays the total number of bytes of data sent from the Access Gateway and from the Web servers since the Access Gateway was last started. |
Requests
The request statistics show the number of requests that are being sent from the browsers to the Access Gateway and from the Access Gateway to the Web servers.
|
Statistic |
Description |
|---|---|
|
Current Requests to Origin Server |
(Access Gateway Appliance) Displays the current number of requests that the Access Gateway has made to the Web servers. Click to view the number of requests for a specific unit of time (1 hour, 1 day, 1 week, 1 month, 6 months, or 12 months). The Value axis displays the number of requests. |
|
Current Requests from Browsers |
Displays the current number of requests that the browsers have made to the Access Gateway. Click to view the number of requests for a specific unit of time (1 hour, 1 day, 1 week, 1 month, 6 months, or 12 months). The Value axis displays the number of requests. |
|
Total Current Requests |
Displays the total number of current requests that the Access Gateway has received from the browsers and that the Access Gateway has sent to the Web servers. |
|
Successful Requests to Origin Server |
(Access Gateway Appliance) Displays the total number of successful requests that the Access Gateway has sent to the Web servers since the Access Gateway last started. |
|
Failed Requests to Origin Server |
(Access Gateway Appliance) Displays the total number of failed requests that the Access Gateway has sent to the Web servers since the Access Gateway last started. |
|
Cumulative Requests to Origin Server |
(Access Gateway Appliance) Displays the total number of requests that the Access Gateway has sent to the Web servers since the Access Gateway last started. |
|
Cumulative Requests to Browsers |
Displays the total number of requests that the browsers have sent to the Access Gateway since the Access Gateway last started. |
|
Total Cumulative Requests |
Displays the total number of cumulative requests that the Access Gateway has processed since the Access Gateway last started. |
|
Requests per Second to Origin Server |
(Access Gateway Appliance) Displays the number of requests that are being sent each second from the Access Gateway to the Web servers. Click to view the number of requests for a specific unit of time (1 hour, 1 day, 1 week, 1 month, 6 months, or 12 months). The Value axis displays the number of requests. |
|
Requests per Second from Browsers |
(Access Gateway Appliance) Displays the number of requests that are being sent each second from the browsers to the Access Gateway. Click to view the number of requests for a specific unit of time (1 hour, 1 day, 1 week, 1 month, 6 months, or 12 months). The Value axis displays the number of requests. |
|
Total Requests per Second |
(Access Gateway Appliance) Displays the total number of requests that are being sent each second from the Access Gateway and from the browsers. |
|
Peak Requests per Second to Origin Server |
(Access Gateway Appliance) Displays the peak number of requests that have been sent in one second from the Access Gateway to the Web servers. |
|
Peak Requests per Second from Browsers |
(Access Gateway Appliance) Displays the peak number of requests that have been sent in one second from the browsers to the Access Gateway. |
Cache Freshness
The cache freshness statistics display information about the cache refresh process. Only the Access Gateway Appliance gathers these statistics.
|
Statistic |
Description |
|---|---|
|
Total “Get If Modified Since” Request |
Displays the total number of Get If Modified Since requests that the Access Gateway has received from browsers. |
|
Total Not Modified Replies |
Displays the total number of 304 Not Modified replies that the Access Gateway has received from the Web servers for updated content. |
|
Cache Freshness |
Displays the percentage of objects in cache that are considered fresh. Click to view the percentage of fresh objects for a specific unit of time (1 hour, 1 day, 1 week, 1 month, 6 months, or 12 months). The Value axis displays the percentage of fresh objects. |
|
Oldest Object in Memory |
Displays how long the oldest cache object has been cached. |
4.4.2 Server Benefits Statistics
Select whether to monitor live or static statistics:
Statistics: Select this option to view the statistics as currently gathered. The page is static and the statistics are not updated until you click .
Live Statistics Monitoring: Select this option to view the statistics as currently gathered and to have them refreshed at the rate specified in the field.
The Server Benefits page displays information about bandwidth and DNS caching:
|
Statistic |
Description |
|---|---|
|
Total Bandwidth Saved |
Displays the amount of bandwidth saved by using data cached by the Access Gateway rather than requesting the data from the Web servers. |
|
Bytes Saved per Second |
Displays how many bytes of data the Access Gateway was able to send from cache rather than requesting it from the Web servers. |
|
Bandwidth Saved |
(Access Gateway Appliance) Displays the amount of bandwidth saved by using data cached by the Access Gateway rather than requesting the data from the Web servers. |
|
Total DNS Lookups Saved |
(Access Gateway Appliance) Displays the number of DNS requests that the Access Gateway could solve locally without performing a DNS lookup. |
|
DNS “Modified Since” Queries Returning False |
(Access Gateway Appliance) Displays the number of DNS Modified Since queries that the Access Gateway was able to service with a false value. |
|
Total Number of Connections Saved |
(Access Gateway Appliance) Displays the number of connections that the Access Gateway has with clients minus the number of connections that the Access Gateway has with Web servers. This statistic indicates the number of connections that the Access Gateway is off loading from the Web servers. |
4.4.3 Service Provider Activity Statistics
Select whether to monitor live or static statistics:
Statistics: Select this option to view the statistics as currently gathered. The page is static and the statistics are not updated until you click .
Live Statistics Monitoring: Select this option to view the statistics as currently gathered and to have them refreshed at the rate specified in the field.
The ESP Activity page displays information about the communication process between the Access Gateway module (ESP) and the Identity Server. These statistics are grouped into the following categories:
Click to review historical statistics.
Application
|
Statistic |
Description |
|---|---|
|
Free Memory |
The percentage of free memory available to the JVM (Java Virtual Machine). Click to view the free memory for a specific unit of time (1 hour, 1 day, 1 week, 1 month, 6 months, or 12 months). The Value axis displays the percentage of free memory. |
Authentications
|
Statistic |
Description |
|---|---|
|
Provided Authentications |
The number, since the Identity Server was started, of successful provided authentications given out to external entities. |
|
Consumed Authentications |
The number, since the Identity Server was started, of successful consumed authentications. |
|
Provided Authentication Failures |
The number, since the Identity Server was started, of failed provided authentications given out to external entities. |
|
Consumed Authentication Failures |
The number, since the Identity Server was started, of failed consumed authentications. NOTE:The consumed authentication failures does not show the number of invalid password attempt failures of the Identity Provider in the statistics page. |
|
Logouts |
The number of explicit logouts performed by users. This does not include logouts where an inactive session was destroyed. |
|
Cached Sessions |
The number of currently active cached user sessions. This represents the number of users currently logged into the system with the following caveat: If a single person has two browser windows open on the same client and if that person performed two distinct authentications, then that person has two user sessions. Click to view the number of cached sessions for a specific unit of time (1 hour, 1 day, 1 week, 1 month, 6 months, or 12 months). The Value axis displays the number of cached sessions. If no sessions have been cached, the value axis is not meaningful. |
|
Cached Ancestral Sessions |
The number of cached ancestral session IDs. An ancestral session ID is created during the failover process. When failover occurs, a new session is created to represent the previous session. The ID of the previous session is termed an “ancestral session ID,” and it is persisted for subsequent failover operations. |
|
Cached Subjects |
The number of current cached subject objects. Conceptually, the cached subjects are identical to the cached principals. |
|
Cached Principals |
The number of current cached principal objects. A principal can be thought of as a single directory user object. Multiple users can log in using a single directory user object, in which case multiple cached sessions would exist sharing a single cached principal. |
|
Cached Artifacts |
The number of current cached artifact objects. During authentication, an artifact is generated that maps to an assertion. This cache holds the artifact to assertion mapping until the artifact resolution request is received. Under normal operations, artifacts are resolved within milliseconds of being placed in this cache. |
Incoming HTTP Requests
Incoming HTTP requests are divided into three categories: active, interval, and historical. As soon as a request is complete, it is placed into the interval category. The interval represents the last 60 seconds of processed requests. At the completion of the 60-second interval, all requests in the interval category are merged into the historical category.
|
Statistic |
Description |
|---|---|
|
Total Requests |
The total number of incoming HTTP requests that have been processed since the Identity Server was started. Click to view the number of requests for a specific unit of time (1 hour, 1 day, 1 week, 1 month, 6 months, or 12 months). The Value axis displays the number of requests for the selected time period. |
|
Currently Active Requests |
The number of currently active incoming HTTP requests. |
|
Oldest Active Request (Milliseconds) |
The age of the oldest currently active incoming HTTP request. |
|
Last Interval Maximum Request Duration (Milliseconds) |
The age of the longest incoming HTTP request that was processed during the last 60-second interval. |
|
Last Interval Mean Request Duration (Milliseconds) |
The mean age of all incoming HTTP requests that were processed during the last 60-second interval. |
|
Historical Maximum Request Duration (Milliseconds) |
The age of the longest incoming HTTP request that was processed since the Identity Server was started. |
|
Historical Mean Request Duration (Milliseconds) |
The mean age of all incoming HTTP requests that were processed since the Identity Server was started. |
Outgoing HTTP Requests
Outgoing HTTP requests are divided into three categories: active, interval, and historical. As soon as a request is complete, it is placed into the interval category. The interval represents the last 60 seconds of processed requests. At the completion of the 60-second interval, all requests in the interval category are merged into the historical category.
|
Statistic |
Description |
|---|---|
|
Total Requests |
The total number of outgoing HTTP requests that have been processed since the Identity Server was started. Click to view the number of requests for a specific unit of time (1 hour, 1 day, 1 week, 1 month, 6 months, or 12 months). The Value axis displays the number of requests for the selected time period. |
|
Currently Active Requests |
The number of currently active outgoing HTTP requests. |
|
Oldest Active Request (Milliseconds) |
The age of the oldest currently active outgoing HTTP request. |
|
Last Interval Maximum Request Duration (Milliseconds) |
The age of the longest outgoing HTTP request that was processed during the last 60-second interval. |
|
Last Interval Mean Request Duration (Milliseconds) |
The mean age of all outgoing HTTP requests that were processed during the last 60-second interval. |
|
Historical Maximum Request Duration (Milliseconds) |
The age of the longest outgoing HTTP request that was processed, since the Identity Server was started. |
|
Historical Mean Request Duration (Milliseconds) |
The mean age of all outgoing HTTP requests that were processed, since the Identity Server was started. |
Liberty
|
Statistic |
Description |
|---|---|
|
Liberty Federation |
The number of Liberty protocol federations performed, since the Identity Server was started. |
|
Liberty De-Federations |
The number of Liberty protocol de-federations performed, since the Identity Server was started. |
|
Liberty Register-Names |
The number of Liberty protocol register names performed, since the Identity Server was started. |
Clustering
An authoritative server is the cluster member that holds the authentication information for a given user session. For a request associated with a given session to be processed, it must be routed (“proxied”) to the authoritative cluster member. If an L4 switch causes a request to go to a non-authoritative cluster member, then that cluster member proxies that request to the authoritative cluster member.
When a request is received, a cluster member uses multiple means to determine which cluster member is the authoritative server for the request. It looks for a parameter on the query string of the URL indicating the authoritative server. It looks for an HTTP cookie indicating the authoritative server. If these do not exist, the cluster member examines the payload of the HTTP request to determine the authoritative server. Payload examinations result in immediate identification of the authoritative server or a user session ID or user identity ID that can be used to locate the authoritative server.
If a user session ID or user identity ID is found, the ID is broadcast to all cluster members asking which member is the authoritative server for the given ID. The authoritative server receives the broadcast message, determines that it indeed holds the given session or user, and responds accordingly.
The higher the number of proxied requests, the lower the performance of the entire system. Furthermore, the higher the number of payload examinations and ID broadcasts, the lower the performance of the entire system.
|
Statistic |
Description |
|---|---|
|
Currently Active Proxied Requests |
The number of currently active proxied HTTP requests. |
|
Total Proxied Requests |
The total number of proxied requests that have been processed, since the Identity Server was started. These requests were sent to a non-authoritative (wrong) box. |
|
Total Non-Proxied Requests |
The total number of non-proxied requests that have been processed, since the Identity Server was started. These requests were sent to the authoritative (correct) box. |
|
Authoritative Server Obtained from URL Parameter |
The total number of authoritative servers identified by using the parameter from the URL query string, since the Identity Server was started. |
|
Authoritative Server Obtained from Cookie |
The total number of authoritative servers identified by using the HTTP cookie, since the Identity Server was started. |
|
Payload Examinations |
The total number of attempted payload examinations to identify the authoritative server, since the Identity Server was started. |
|
Successful Payload Examinations |
The total number of successful payload examinations to identify the authoritative server, since the Identity Server was started. |
|
Identity ID Broadcasts |
The total number of attempted Identity ID Broadcasts to identify the authoritative server, since the Identity Server was started. |
|
Successful Identity ID Broadcasts |
The total number of successful Identity ID Broadcasts to identify the authoritative server, since the Identity Server was started. |
|
Session ID Broadcasts |
The total number of attempted Session ID Broadcasts to identify the authoritative server, since the Identity Server was started. |
|
Successful Session ID Broadcasts |
The total number of successful Session ID Broadcasts to identify the authoritative server, since the Identity Server was started. |