1.1 Data Capture for Performance and Service Level Data
The Data Warehouse is an integral part of the ability of NetIQ Operations Center to store alarm history and the ability of the Service Level Manager (SLM) to capture performance and service level information so that it can be exposed and analyzed later.
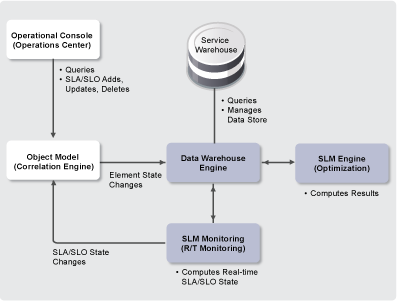
Figure 1-1 provides an overview of how the Service Warehouse stores and feeds data for the Operations Center server:
Figure 1-1 Service Warehouse High-Level Architecture
The Operations Center 5.5 Server Configuration Guide explains the process of setting up database definitions, Time Management objects (time categories, calendars, schedules), and Data Warehouse features (profiles, expressions, data warehouse settings) that are used by the Service Warehouse to store alarm history, performance, and service level information.
Basically, data is captured through profiles that match one or more elements based on criteria defined by the administrator. Expressions defined for a profile determine the type of data that is captured, such as alarm severity, element conditions, and alarm fields.
After a Operations Center administrator configures the data capture, users can view the information in various ways, depending upon the type of data.
Capturing and storing performance and service level data requires the purchase of the Service Level Manager. At purchase, you are given a specific license key to allow access to additional features for the purpose of capturing and analyzing historical performance data.
Performance data events are stored in one of two ways:
-
Scheduled Event: The scheduler determines that a collection event should be fired, and an expression polls an element for specific information.
-
Non-Scheduled Event: An event is received from a specific element and an expression (such as an Alarm expression or Alarm Field expression) is “matched” to the element.