8.1 Configuring the Alarms Portlet
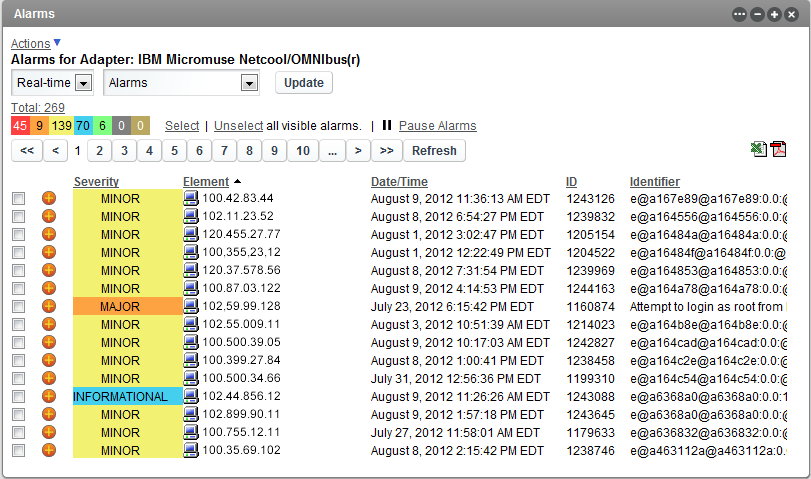
The alarms portlet shows a detailed listing of alarms that allows you to click and open the alarm’s properties. A total alarm count indicates the total number of alarms for the element while severity indicators show the number of alarms for each severity. As in the Operations Center console, alarm operations can be performed (when available), alarm filters can be created and applied, and alarm data can be exported to an Excel or PDF file.
Figure 8-1 Alarm Portlet
The Alarms portlet returns a maximum number of alarms based on a property set on the Operations Center server. For instructions on configuring this property, see Section 7.8.1, Configuring Default Alarms Limits Returned from the Operations Center Server.
The Alarms Portlet can also be used to set the starting element for other portlets on the Web page, similar to the Navigation portlet. To configure the Alarms portlet to drive other portlets using Navigation, see Step 3 and Section 7.4, Using Navigation Mode to Drive Multiple Portlets.
The Alarms portlet is also available as a view from other Operations Center portlets including Layout, Tree Map, Element Properties, Properties Table, Show Impacted, Root Cause, Chart Builder, Performance and Summary. Click and select > from any of these portlets.
[The following sections cover various Alarm portlet functionality:]
8.1.1 Viewing Alarms
The actual alarms shown in the portlet/view depend on various factors set in the configuration options:
-
Alarm Type: Displays the following types of real-time events:
- alarms
- audit events
- service level breaches
- service level metrics
For more information on alarms, see Filtering and Managing Alarms in the Operations Center 5.5 User Guide.
For more information on service level breaches and metrics, see the Operations Center 5.5 Service Level Agreement Guide.
-
Severity: Displays alarms of varying severities.
For more information on alarm severities, see Viewing Alarm Severity in the Operations Center 5.5 User Guide.
-
Alarm Filters: Limits the number of alarms shown. You can check to see which alarm filters are enabled.
To view the listing:
-
Do any of the following:
-
Click a severity color indicatory to hide or show matching alarms.
-
Click any column heading to sort the rows in the table in either ascending or descending order.
-
Use the arrow or number buttons to move through data in either the alarm properties or the alarms listing.
-
Click the button, or click on any alarm to pause alarms.
-
Right-click an alarm to access additional options, such as properties, add comments, and driving other portlets (if enabled).
-
Double-click any alarm to open a list of all alarm properties in a new window.

(NetIQ AppManager elements only) Use the three tabs to view a summary of alarm information, all details for the alarm, and even add a comment to the alarm. For more information, see
AppManager Operations Portal Features for NetIQ AppManager Alarms
in the NetIQ AppManager Operations 5.5 Portal Getting Started Guide.If the Alarm Properties window becomes hidden behind the main browser window when another alarm is clicked, switch back to the Alarm Properties window to view properties on the new alarm.
-
Click to refresh the data.
-
Click the Excel or PDF icons to export the alarm data to an Excel or PDF file.
If the file download window does not open, check your browser settings to see if pop‑up dialog boxes are blocked.
-
8.1.2 Performing Alarms General Configuration
To configure preferences for the Alarms portlet:
-
Click
 and select
  and update settings on the tab:

For other portlets, the tab is found under the tab.
-
Specify the following options:
Alarm Table Width: The size of the table expressed as a percentage of the portlet page. Defaults to 100%.
Alarm Table Height: The number of rows displayed at one time in the table; expressed in pixels. Defaults to 300.
Filter by Severity: Specify a comma separated list of severities (such as “CRITICAL,MINOR”) to hide alarms with specific severity levels. Alarms with matching severities will not show in the alarms portlet. Leave this field empty to show all alarms. In addition to this option, you can also filter alarms by severity using the colored bar when viewing the alarms.
Alarm Columns: Specify a comma separated list of alarm columns to display (and hide all other columns). Leave blank to display all columns. Columns available to display are dependent on the source of the alarms.
If alarms are currently displayed in the portlet, click the browse (...) button to select columns from a list based on a sampling from the current alarms. If no alarms are currently displayed in the portlet, the selector is unable to show columns to select from. Use the left and right arrow buttons to move a column name between the Available list and the Selected list. Use the up and down arrows to reorder column names.
Sort Alarms by: Specify a column name to use as a sort key for displayed alarms. Severity is the default sort key. You can also change the sort key while viewing the alarms table by clicking a column heading.
Alarms per Page: Specify the maximum number of alarms to show on each page.
-
Select or deselect the following check box options:
Show alarm selectors and filter options: Selected by default. Shows alarm selectors at the top of the alarms portlet. This includes alarm type drop-down lists and update/pause buttons to apply, alarm filters by severity and options to select or unselect all alarms. Deselect the check box to hide these options.-
Sort alarms in ascending order by default: Selected by default. Deselect the check box to initially sort in descending order. Use this option or click column headings when viewing the table to change the sort order.
Highlight alarm rows with severity color: Not selected by default; only the alarm severity column is shaded in each row. When selected, shades the entire row the same color as the severity.
Enable alarm operations: Selected by default. Enables alarm operations to be performed in the Dashboard as they are on the Operations Center console. Deselect the check box to prevent users from performing alarm operations.
Show PDF/Excel export links: Selected by default; allows exporting alarms. Deselect to remove the export options.
Refresh portlet when updates occur: Selected by default. Enables the Dashboard to receive automatic updates from the Operations Center server as content changes occur. Deselect to manually control updates. Note that the Alarm portlet does not support push updates for SLA alarms.
Pause alarms when selecting or driving alarms: Selected by default. Incoming alarms are halted when an alarm is selected. To resume alarms, click the link.
Enable navigation mode: When selected, right-click an alarm and select to drive the content in other portlets. A single-click pauses alarms and a double-click opens alarm properties regardless of whether this option is enabled or not. For more information about setting up portlets to be driven by other portlets, see Section 7.4, Using Navigation Mode to Drive Multiple Portlets.
Enable historical alarms: By default, real-time alarms are shown. To show real-time audit events, service level breaches, or service level metrics; select the associated check box, then select the desired options for type of alarms and date range from the drop-down lists.
-
Click .
8.1.3 Applying and Creating Alarm Filters
View a subset of alarms by applying a filter based on one or more alarm properties, such as severity, element ID, or date/time stamp. For example, apply a filter to display only those alarms with a specific severity message or class, or alarms received within a specific date and time range. Each filter consists of one or more conditions, combined using AND or ANY logic.
Understanding Alarm Filters
Note the following important rules about Alarm filters on portlets:
-
Alarm Filters are shared by all Alarm portlets: A single list of alarm filters is available to users of any alarm portlet.
-
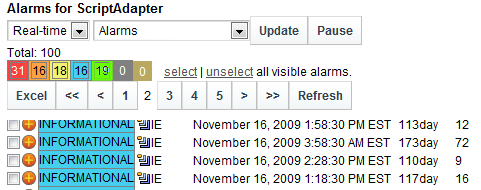
Applying an alarm filter does not change the total alarm count for each severity: At the top of the alarms portlet (if the check box is selected on the tab). For example, if there are a total of 100 CRITICAL alarms, but an applied filter removes these alarms from the table, 100 still displays next in the red severity button.
-
Filters are applied in the order in which they are listed: Multiple filters are applied using the AND operator, meaning the resulting set of alarms must match all the active filters.
When is enabled in portlet , alarm count totals displays at the top of the alarms component. These alarm count totals do not change even when alarm filters are applied.
Figure 8-2 Alarms for Script Adapter
Enabling an Alarm Filter
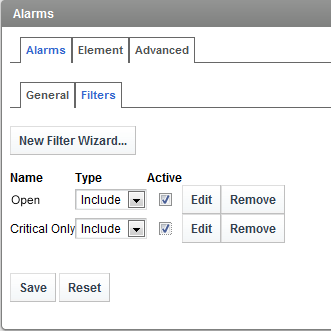
To enable an alarm filter (or to see what is enabled):
-
Click
and select to open the tab.
Note that for other portlets, open the tab to get to the tab.
-
Select the check box next to filters that should be applied.
Only the active filters are applied to the alarms; other filters are ignored.
-
From the drop-down list, specify if matching alarms should be included in the view or excluded from the view by selecting or .
-
Click to apply the settings, then click the
 ( and Return to Full Page link) to return to the alarms view.
The active filters are applied and the filtered alarms display.
Creating an Alarm Filter
To create an alarm filter:
-
Click
and select to open the tab.
Note that for other portlets, open the tab to get to the tab.
-
On the tab, click to open the Alarm Filter dialog box.
-
In the field, specify a name for the filter.
-
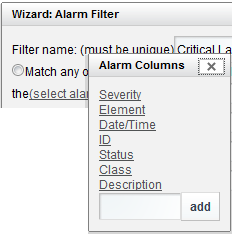
Click to display a filter condition row:
-
Define the condition statement by selecting the following:
-
Alarm Column: Click the link to specify the alarm column whose values are considered.
The available alarm column selectors varies depending on adapter and currently selected elements. The input field at the bottom can be used to enter a column name that is not listed. This could be used later for alarms that originate from other elements, because filters are shared by all Alarm portlets.
-
Operator for Comparison: An operator is used to compare the alarm column value to a specified value (greater than, less than, and so on).
Operators and comparison value selectors vary depending on the alarm column type and adapters. For more information, see Understanding Operators and Alarm Values.
For example, the following condition selects alarms received within the last 30 minutes:
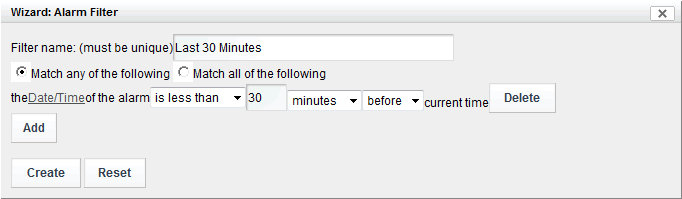
-
Comparison Value: A comparison value is used to determine whether an alarm is selected.
When Severity is the selected alarm column, a drop-down list of severity codes and colors displays in the right column. The codes vary among adapters.
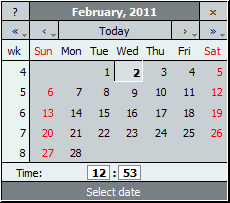
For a specific date/time comparison, use the calendar selector to select a date. In some cases, a relative “rolling” date/time comparison is necessary. For example, a filter could select alarms that are within 30 days of the current date/time. Use the “is less than” or “is more than” operator to specify the time interval for comparing the current date and time. Also specify whether the filter should pull alarms that are before or after the current date/time.
-
Text-Type Columns: Specify case-sensitive matching for text-type alarm columns. Select the check box to match exactly each letter in the alarm column with the string entered in the filter field.

-
-
To define another condition, click .
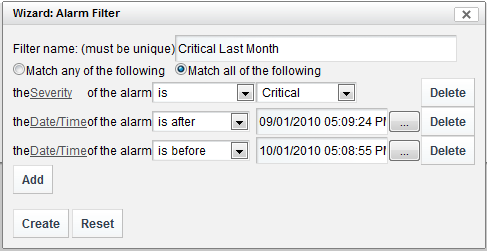
The following example shows a filter with two statements.
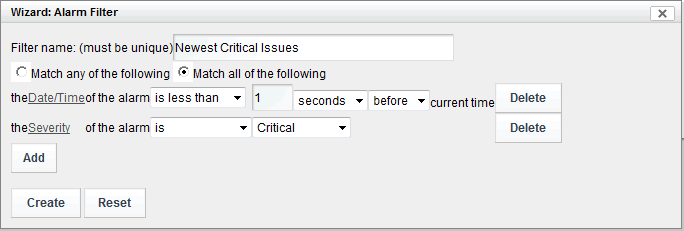
The filter matches alarms with a date and time stamp before the specified date/time and a CRITICAL severity.
-
Select the or radio button to determine whether alarms must meet any (OR logic) or all (AND logic) of the condition statements defined for the filter.
-
Click to create the filter.
Don’t forget to enable the filter! See Enabling an Alarm Filter.
Understanding Operators and Alarm Values
Table 8-1 provides an overview of the relationships among the three fields used to define alarm filters. The available operators depend on the type of alarm column.
Table 8-1 Relationships Among Alarm Filter Values
|
Alarm Column Type |
Operators |
Match Criteria |
Notes |
|---|---|---|---|
|
Text-based (such as Element, Class, Status, Description) |
|
Specify appropriate value based on selected alarm column. |
|
|
Date, Time |
|
Specify Date/Time. |
To select a date range, create a before and an after statement, joined by the Match all operator. |
|
|
|
Specify a date/time interval to compare with current time. This is a relative date/time comparison. |
For example, to match dates that are within 30 days earlier than the current date, use the criteria: date/time is less than 30 days before the current date. |
|
Severity |
|
Select from severity levels appropriate to the adapter. |
Use is to not exclude all but one severity code. To select a contiguous range of severity codes, create two statements using higher than and lower than, joined by the Match all operator. |
|
Numeric |
|
Enter the number. |
For exact matches, use is/ is not. For partial matches anyplace in an alarm value, use contains/ does not contain. For partial matches using the first or last characters, use begins with/ends with. To select a contiguous range of values, create two statements using greater than and less than, joined by the Match all operator. After placing the cursor in the filter value column (the last column in the row), enter a value. Otherwise, it is not possible to edit the other columns or close the Alarm Filter dialog box. An error message prompts for a numeric value. |
Editing and Deleting Filters
Alarm filters can be edited and deleted.
IMPORTANT:Ask other users who might share an alarm filter before you modify or remove it.
To edit or delete filters:
-
To edit a filter:
-
Edit the filter.
-
Click .
-
Click next to a filter name to open the Alarm Filter dialog box.
-
-
To delete a filter:
-
Click next to a filter name to display a confirmation dialog box.
-
Click to confirm the deletion.
The filter disappears from the pane.
-
8.1.4 Performing Alarm Operations
With the alarms portlet, you can perform many of the same operations against alarms that can be performed in the Operations Center console. In some cases, as with Service Level Breaches, alarm operations available in the Dashboard are not identical to those available in the Operations Center console.
Alarms operations are enabled by default in the alarm portlet configuration. The Dashboard has a global option to show alarm operations in all portlets that is set in the Operations Center Dashboard Configuration Manager. However, the configuration options in each portlet override the settings in the Operations Center Dashboard Configuration Manager.
To perform alarm operations:
-
(Optional) Select more than one alarm by selecting the check boxes for the desired alarms.
-
Right-click the
 icon for an individual alarm or for one of the selected alarms, then select the alarm operation.
If multiple alarms are selected, alarms operations are applicable for all currently selected alarms.
The operations available depend on the source of the alarm(s). For more information about alarms, see Filtering and Managing Alarms in the Operations Center 5.5 User Guide.