7.8 Adjusting Time Intervals
7.8.1 Changing the Chart Time Interval Using a Bookmark
To change the chart time interval using a bookmark:
-
In the view, click .
A list of commonly used time intervals (such as last x minutes or hours) displays in the drop-down list.
-
Select a time interval.
The chart updates to display data for the selected interval.
7.8.2 Changing the Start and End Dates Used in a Chart
To change start and end dates on a chart:
-
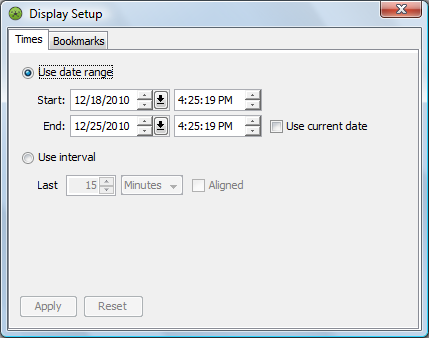
In the view, double-click the timeline or click to open the Display Setup dialog box:
-
Click the tab:
-
To select new starting or ending dates, do the following:
-
Select the radio button and enter a start and end date/time.
-
Select the check box to use the current date as the default end date.
-
-
Click .
The view timeline updates to display the specified dates.
-
Click to close the dialog box.
7.8.3 Changing the Time Interval Used in a Chart
To change the time interval:
-
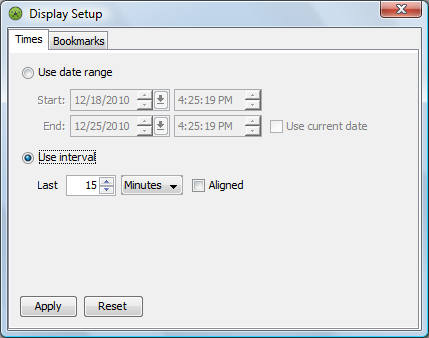
In the view, double-click the timeline or click to open the Display Setup dialog box.
-
In the Display Setup dialog box, select the radio button.
-
Click the drop-down list, then select the time interval: , , , , or .
-
Use the Last spinner to select the numeric increment.
-
Do one of the following:
-
To use a rolling time interval display, leave the check box deselected.
-
To use an aligned display, select the check box.
-
-
The view timeline updates to display the specified time interval.
Click .
-
Click to close the dialog box.