1.3 Gathering Information for Support
For some reported incidents, Support needs information from you about your Operations Center configuration, console, or server to assist in troubleshooting the potential cause of the problem.
-
Section 1.3.1, Running mosconfigprobe to Retrieve Configuration and Environment Information
-
Section 1.3.2, Running mymoprobe to Retrieve Dashboard Configuration Information
-
Section 1.3.4, Gathering Information about the Operations Center Console
-
Section 1.3.6, Using the SIGQUIT Command to troubleshoot the Operations Center server for UNIX
1.3.1 Running mosconfigprobe to Retrieve Configuration and Environment Information
The mosconfigprobe script gathers information on your patch level, platform, Java* environment, memory and GC usage, configurations, adapters, and logs for a specified number of days. This tool can safely be run while the Operations Center server is up.
The configprobe.xml configuration file is used to specify the files and log files that are captured in the output file.
To generate a mosconfigprobe output file to attach to your service request:
-
If necessary, update the /OperationsCenter_install_path/config/configprobe.xml file to change any default mosconfigprobe configuration values.
By default, mosconfigprobe retrieves all log files available in the log directories, but is not recursive. Modify the number of days of log files to retrieve by editing any log element daystogather attribute values.
If log files are in different directories, uncomment the Logs section and specify the directories where logs are located.
-
At a command prompt, issue the following command from the /OperationsCenter_install_path/bin directory:
./mosconfigprobe
where OperationsCenter_install_path is the Operations Center installation directory.
-
Attach the output ZIP file to your open service request.
The output file is saved to the /OperationsCenter_install_path/bin directory, in the format of probe.Version_Number.zip.
1.3.2 Running mymoprobe to Retrieve Dashboard Configuration Information
The /OperationsCenter_Dashboard_install_path/bin/mymoprobe script gathers information on your dashboard configuration. This tool can safely be run while the dashboard is running.
To generate a mymoprobe output file to attach to your service request:
-
At a command prompt in the /OperationsCenter_Dashboard_install_path/bin directory, issue the following command:
./mymoprobe
where OperationsCenter_Dashboard_install_path is the Operations Center Dashboard installation directory.
-
Attach the output ZIP file to your open service request.
The output file is saved to the /OperationsCenter_Dashboard_install_path directory, in the format of dashboardprobe.Version_Number.zip.
1.3.3 Running cmsprobe to Retrieve Configuration Management System (CMS) Configuration Information
The /OperationsCenter_CMS_install_path/bin/cmsprobe script gathers information on your CMS configuration. This tool can safely be run while the dashboard is running.
To generate a cmsprobe output file to attach to your service request:
-
At a command prompt in the /OperationsCenter_CMS_install_path/bin directory, issue the following command:
./cmsprobe
where OperationsCenter_CMS_install_path is the Operations Center CMS installation directory.
-
Attach the output ZIP file to your open service request.
The output file is saved to the /OperationsCenter_CMS_install_path directory, in the format of cmsprobe.Version_Number.zip.
1.3.4 Gathering Information about the Operations Center Console
The context of each thread in the client application is written to the Java console. You can cut and paste this information into an e‑mail and send it to support.
To obtain information about the Operations Center console on Windows* and UNIX:
-
From the desktop, click > to open the Run dialog box.
-
Open the Java Web Start Application Manager by doing one of the following:
-
Windows: Enter javaws -viewer in the field (use lowercase), then click .
-
UNIX: At a command line in the directory where Java is installed, enter javaws (use all lowercase).
The Java Web Start Application Manager dialog box opens.
-
-
Click > to open the Java Web Start Preferences dialog box.
-
Click the tab.
-
Select the check box.
-
Click .
-
Click
 () to close the Java Web Start Application Manager dialog box.
-
Close all Operations Center consoles.
-
Restart the Operations Center console.
The JavaConsole dialog box opens each time the Operations Center console starts.
-
Cut and paste the information in the Java Console dialog box into your open service request.
1.3.5 Diagnosing the Operations Center Server
Operations Center provides the ability to execute a dump of Operations Center system information to a file that can assist Technical Support with troubleshooting the problem. The information is obtained by identifying the process ID (PID) for Operations Center, which is found in the daemon.trc file in the stdout directory.
Windows
To obtain information about the Operations Center server on Windows:
-
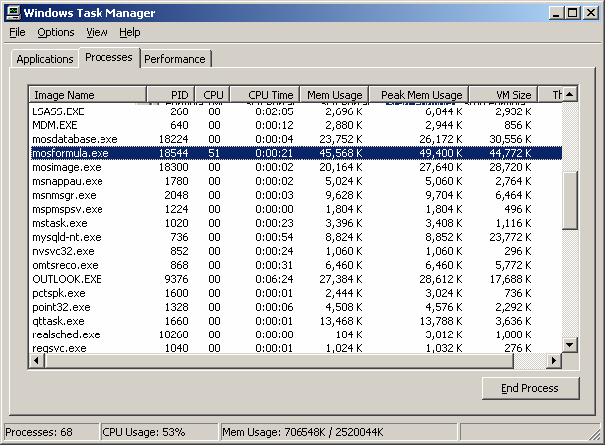
From the desktop, right-click an empty space on the task bar at the bottom, then select r to open the Windows Task Manager.
-
Click the tab to display the Processes page:
-
Locate the PID of the mosformula.exe process in the Windows Task Manager.
In the example above, the mosformula.exe PID is 18544.
-
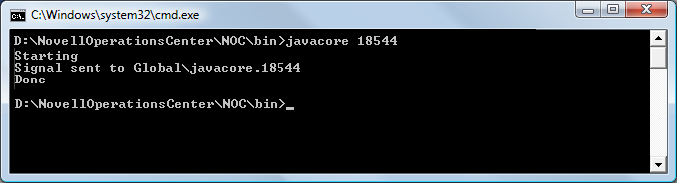
From a command line in the /OperationsCenter_install_path/bin directory, enter javacorePID to initiate a process to write the system information about Operations Center to the daemon.trc file.
PID means Process ID for mosformula.exe.
It can take several minutes to complete writing the information.
-
Using a text editor, open /OperationsCenter_install_path/logs/daemon.trc to verify that the results of the thread dump are recorded.
-
Repeat Step 4 and Step 5 twice to ensure that all system information is recorded.
-
Attach the daemon.trc, formula.trc, and fsgc.log files to your open service request.
UNIX
To obtain system information about Operations Center on UNIX, a signal is sent to the application to generate a core file. Before a signal can be sent, determine the type of signal required. The core file can be generated as a separate file (the AIX VM does this) or the information can be placed into one of the standard Operations Center trace files (daemon.trc).
-
To display the Operations Center PID, go to a command line and enter the following command:
$ ps ef|grep Formula.properties
The Formula process properties display, as shown:
The formula 35442 38448 0 10:56:43 pts/0 117:04 /usr/java130/jre/bin/java –classpath /apps/formula/html/classes/common.jar:/apps/formula/html/classes:
/apps/formula/html/classes/swingall.jar:/apps/formula/classes/server.j
ar:/apps/formula/classes:/apps/formula/classes/rsa.jar ‑Xmx256m com.mo
sol.Formula.Server.ServerImpl /apps/formula/config/Formula.properties ‑CORBA.Port 2000
-
Identify the Formula PID, which is located following formula in the properties. In the example above, the Formula PID is 35442.
-
Send a SIGQUIT signal by performing one of the following actions for the appropriate operating system:
-
Sun* or HP*: At a command line, enter:
kill –s‑quit formula PID
-
AIX*: At a command line, enter:
kill –3 PID
-
Linux*: At a command line, enter:
kill –s quit PID
PID means Formula process ID.
The operating system dumps the thread information to the daemon.trc file.
-
-
Verify that the daemon.trc file contains the system information.
-
Attach the /OperationsCenter_install_path/logo/daemon.trc file to your open support ticket.
1.3.6 Using the SIGQUIT Command to troubleshoot the Operations Center server for UNIX
Issue the SIGQUIT command to troubleshoot the Operations Center server for UNIX systems. The SIGQUIT command captures system information when the Operations Center server is running and is in the locked state. It is often useful to have several consecutive SIGQUIT signals issued to be able to see if the server is processing information or if it has locked up in a certain segment of code.
The SIGQUIT command is indicated when:
-
The mosstatus command does not return any output and hangs
-
The server appears to be running with a mosstatus command, but users cannot log in
-
A ps –ef | grep jre or a ps –ef | grep java on UNIX indicates that your server processes are running, but the mosstatus command doesn’t return a running server
-
The Operations Center console displays the message Locating server..., and your server processes are running
-
The Operations Center console displays the message Initializing user interface..., but the Operations Center console does not display properly and your Operations Center processes are running
-
A grep for the Web server port on 8080 is not established and the Operations Center console cannot locate the Operations Center server for connection, but your Operations Center server processes are running