8.3 Business Process View Example
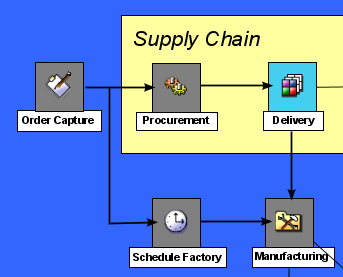
This Layout view illustrated in Figure 8-3 identifies key steps in a business process. Steps are linked to elements so that the fill color use to represent each step corresponds to the current element state. End-to-end service management enables monitoring and controlling service problems from a single console view. The drawing integrates all existing sources of infrastructure data into a single place, easing the problem of diagnosis where cause and effect are separate.
Figure 8-3 shows the business processes that support order processing. Color-coding reflects each process’ state — red for CRITICAL, green for OK, and so on. IT staffers can right-click a process in trouble and immediately see what technology issue is causing the problem and what other technology and business areas that issue is impacting.
Figure 8-3 Completed Supply Chain Business Process Layout View

Creating this example requires dragging and dropping elements from different branches of the hierarchy in the pane to the Layout view.
Start by changing the background color and adding a filled rectangle to draw attention to a specific set of steps:
8.3.1 Changing the Background Color
To change the background color of the business process view:
-
Right-click the background, then select .
-
Select a color from the palette.
In this example, a blue background is used.
8.3.2 Adding Elements
To add elements to the business process view:
-
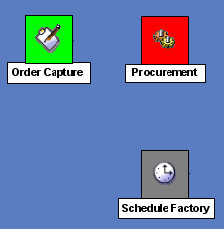
Drag and drop elements from the pane to create the correct sequence of steps in the business process:
-
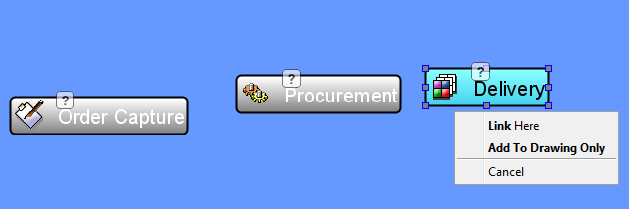
When prompted, select to a placement action for the element.
By default, the dropped elements use the Gradient Bubble node style.
For details on the menu items, see Section 5.0, Adding Elements and Updating Drawing Components Using Element Properties.
8.3.3 Changing the Node Style
By default, the Bubble Gradient node style is used. In this application, a smaller node style is preferable, to enable displaying the maximum number of elements on the screen at one time. In this example, the Classic Small node style is used.
To change the node style for all elements in the drawing:
-
In the pane, expand > > .
-
Drag the Classic Small node style from the pane and drop it on an element in the drawing.
The following illustrates changing all node styles to ClassicSmall:

-
From the menu, select .
All elements in the drawing update to use the new node style.
The following illustrates elements using the node style:
8.3.4 Adding the Rectangle
Add a rectangle to highlight specific elements in the Supply Chain process after completing all drag and drop actions. Otherwise, if you drop an element onto a shape, such as a rectangle, the element is bound to the shape.
To add the rectangle:
-
Click
 () on the drawing toolbar.
-
Drag to draw an outline of the shape anyplace in the view, then release the mouse button to display the finished shape.
-
Drag the shape to the correct location in the drawing.
-
If it is necessary to modify the size, click and drag any of the shape’s endpoints.
-
Select the rectangle, then click the appropriate fill color in the Palette.
-
If the rectangle displays on top of the elements, thereby obscuring them, change the display’s order by right-clicking the rectangle and selecting > .
The rectangle moves beneath the elements:

8.3.5 Adding Descriptive Text
Use the  Text tool to add descriptive text to the drawing. This text is not bound to any elements.
Figure 8-4 Add descriptive text to the drawing

8.3.6 Adding Arrows
As a final step, use the drawing toolbar to add arrows showing the relationships among the steps in the business process.
To draw an arrow:
-
Click
 ().
().
-
Click to start and drag to draw the line.
-
Release the mouse to finish drawing:
The above illustrates that you can add arrows to show the process flow.
To change the line width or add arrow heads, see .